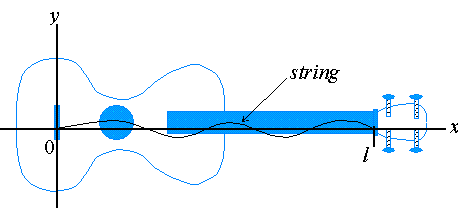
Functions of two variables are important for reasons other than that their graph is a surface. In particular, a function of the form u( x,t) is often interpreted to be a function of x at a given point in time. For example, let's place an xy-coordinate system on a violin whose strings have a length of l, as is shown in the figure below:

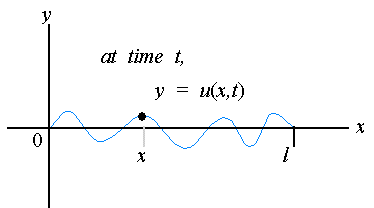
If u( x,t) is considered the displacement of a string above or below a horizontal line at a point x and at a time t, then y = u( x,t) is the shape of the string at a fixed time t.

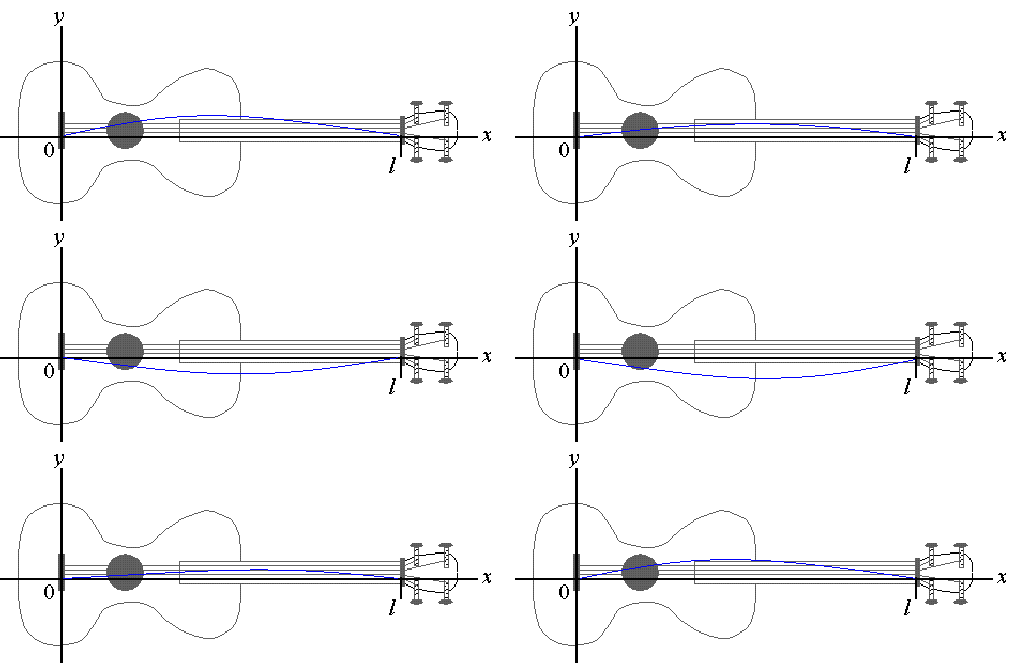
Thus, u( x,t) models the motion of the string as t increases.

EXAMPLE 7 The displacement of a certain 1 foot long violin string at time t in seconds and at distance x from the bridge is given by
u(x,t) = 60 sin
x
p cos(880pt) Describe the shape of the string at times t=0, 0.5, 1, and 1.5 milliseconds.
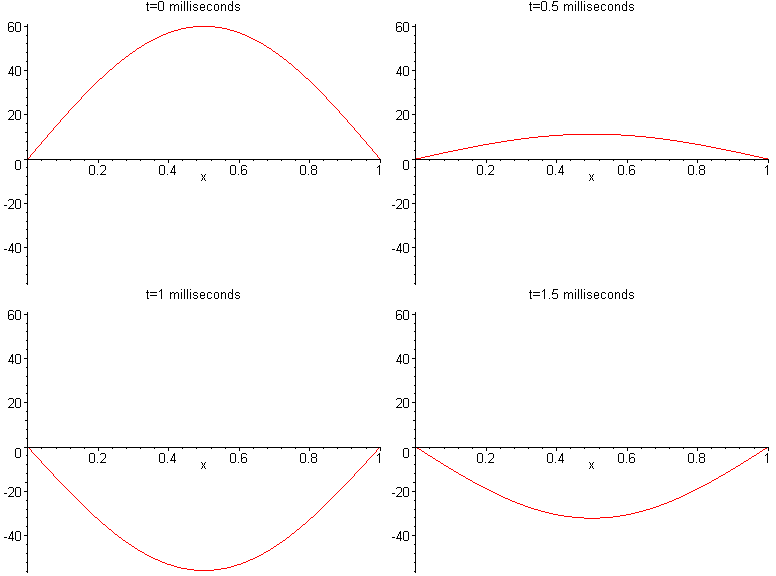
Solution: At time t=0, we have the curve u(x,0) = 60sin(x/p), which is a sine curve beginning at the origin and intersecting the x-axis again at x=1. At time t=0.5 millisecond, which is t=0.0005 seconds, we have the curve
u(x,t) = 60 sin(px)cos(0.44p) = 11.243 sin(px) At time t=1 millisecond, which is t=0.001 seconds, we have
u(x,t) = 60 sin(px)cos(0.44p) = -55.787 sin(px) and at t=1.5 milliseconds = 0.0015 seconds, we have
u(x,t) = 60 sin(px)cos(0.44p) = -32.15 sin(px) These curves are shown in sequence in the "slide show" below:

Likewise, u( x,t) might represent the temperature at a distance x from one end of the rod at time t.

The function u(x,t) then models the evolution of the temperature distribution over time. In general, any process that can be modeled by the graph of a function of x at any given time t can be modeled by a function of 2 variables.