Curves in Polar Coordinates
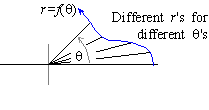
It is customary in polar coordinates to write the
distance r as a function of q. In particular, r = f( q)
assigns a distance from the origin to each angle q, thus forming a
curve.

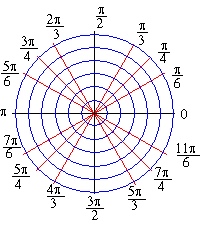
We can produce a rough sketch of a curve in polar coordinates by determining r
at key angles, such as q = 0, p/6, p/4, p/3, p/2, 2p/3, etc., and then plotting those points on a
polar coordinate grid such as the one shown below:

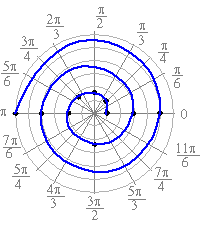
EXAMPLE 4 Sketch the graph of the function
Solution: First, let us choose some typical values of q and
compute r for those angles.
Now let's plot those points on the grid and connect them to obtain a sketch
of the graph of the function:

The fact that x = rcos( q) and y = rsin(q) implies that the graph of r = f( q) is
parametrized by
|
r( q) =
á f( q) cos( q) ,f( q) sin( q)
ñ |
|
This allows us to work with curves as parametric equations. In addition, it
shows us that if f( q) is periodic with a period of 2p, then r( q) is a closed curve.
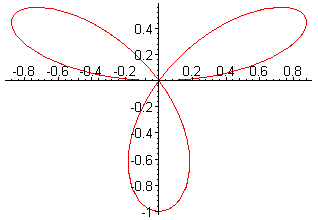
EXAMPLE 5 Parametrize the graph of r = sin( 3q) for q in [ 0,2p] , and then sketch the
resulting curve.
Solution: A parametrization of the polar curve r = sin(3q) is given by
|
r( q) =
á sin( 3q)cos( q) ,sin( 3q) sin( q)
ñ |
|
When q = 0 or q = 2p/3, then r = sin( 0) = sin( 3·2p/3) = 0. As a result,
which implies that r( q) is a closed curve on [ 0,2p/3] . Thus, the graph of r = sin( 3q) forms a single loop for q in [ 0,2p/3] . It then
follows that it forms another loop when q is in [ 2p/3,4p/3] and yet another loop for q in [ 4p/3,2p] .

Since sin( 3q) has period 2p, the image of r = sin( 3q) is a closed curve.
Check Your Reading:
Is 2p the smallest positive period of r = sin( 3q)


