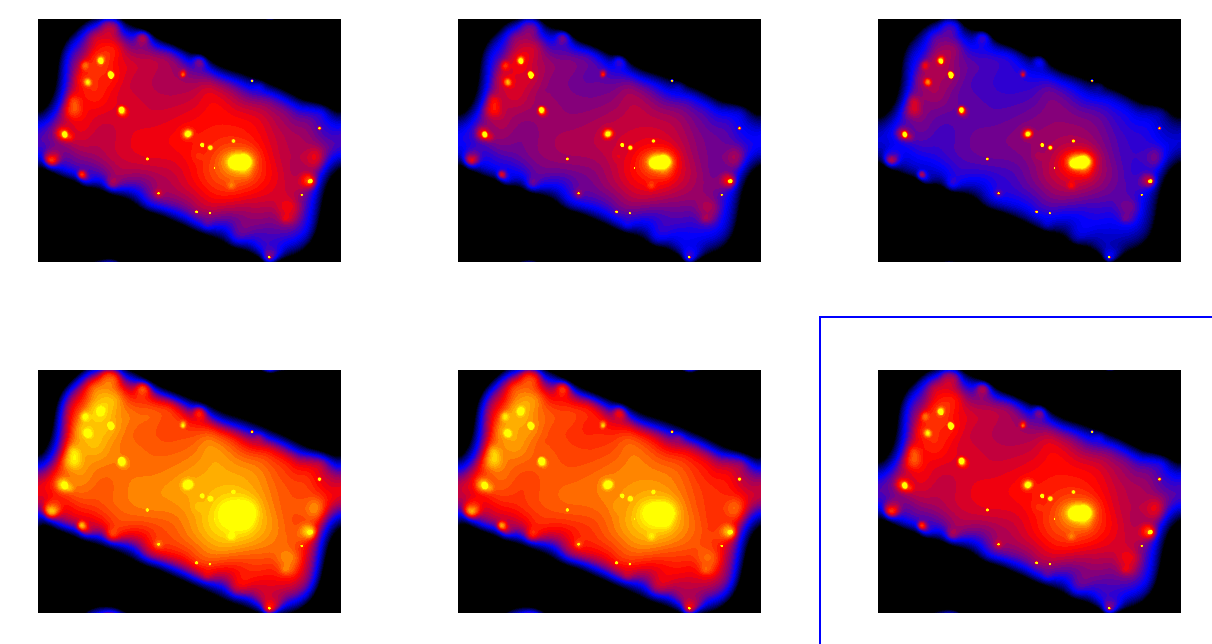
Various Chandra maps of the NGC 4410 galaxy
group, assuming different energies in making the
exposure map

The top left picture is the Chandra 0.3 - 8 keV
NGC 4410 galaxy group image, assuming an 0.8 keV
monochromatic exposure map.
In producing the top middle picture, an 1.0 keV monochromatic
exposure map was produced.
The top right was made with a 1.5 keV monochromatic
exposure map, while the lower left was created
assuming a 3.0 keV monochromatic spectrum.
The lower middle was made using an exposure
map weighted by the spectrum of NGC 4410A.
For the lower right, the exposure map was
weighted by the spectrum of the NGC 4410A+B complex.
All four images are displayed with the same stretch.
Note that the extended emission is brighter
with the 0.8 keV and 3.0 keV exposure maps, as well
as the weighted maps.
Note, however, that the extended emission in
all six maps shows the same general
morphology. This consistency
in morphology shows that the basic result, that there
is extended emission in this group, is robust, but
that the absolute flux calibration of this
diffuse emission is somewhat uncertain.

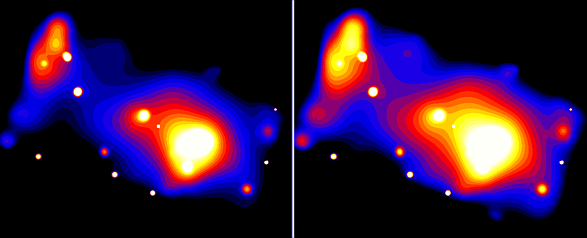
These are both low energy (0.3 - 1 keV) maps.
The image on the left was made with a 1 keV
monochromatic exposure map, while the one on the right
was made with a 0.8 keV monochromatic exposure map.
They are both displayed with the same stretch.
Note that the image made with the 0.8 keV exposure
map shows slightly brighter
extended emission.
Note that the extended emission in these
two maps shows the same basic morphology.

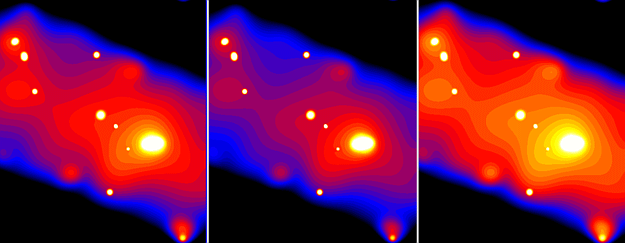
These are all middle energy (1 - 2.5 keV) maps.
The image on the left was made with a 1 keV monochromatic
exposure map; the image in the middle was made
with a 1.5 keV monochromatic exposure map,
while the map on the right was made with a 0.8 keV
monochromatic map.

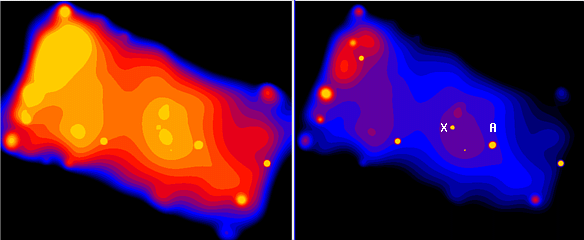
These are both high energy (2.5 - 8 keV) maps.
The image on the left was made with a 3 keV monochromatic
exposure map; the image in the middle was made
with a 0.8 keV monochromatic exposure map.
The source marked 'A' is the nucleus of NGC 4410A,
while the source marked 'X' is the bright point source
in the NGC 4410A+B-C bridge.
Note again
that the
same basic
structure
is present
in both images, showing that the choice of exposure
map parameters does not affect the basic morphology
of the map, just the absolute flux levels.
Note also that there
is apparent diffuse high energy radiation coming
from
between NGC 4410A and
the bridge source.
Note also that this morphology differs
from that
seen at lower
energies.
To return to Beverly Smith's home page, click
here.


