Chandra X-Ray Imaging
of the Interacting Starburst Galaxy System NGC 7714/5:
Tidal ULXs, Emergent Wind, and Resolved HII Regions
Beverly J. Smith,
(Department of Physics, Astronomy, and Geology
,
East Tennessee State University),
Curtis Struck (Iowa State University) and Mike Nowak (MIT).
The
NASA Chandra X-ray Observatory
has been used
to make X-ray maps of the
interacting galaxy system NGC 7714/5.
Here are the figures from the paper
on the observations (
Smith, Struck, and Nowak 2005, Astronomical Journal,
129, 1350).
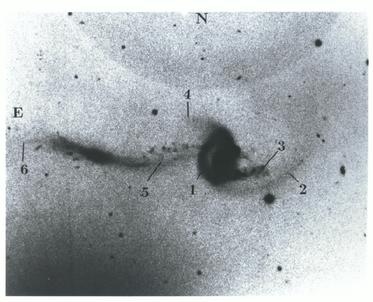
Figure 1:
A 5.0' X 3.9' optical photograph of NGC 7714/5 from the
Arp Atlas (1966).
North is up and east is to the west. NGC 7714 is the larger galaxy
to the west. Note the partial ring (1), the two western tails (2,3),
the northeastern tail of NGC 7714 (4), the bridge (5), and the eastern
tail of NGC 7715 (6).

Figure 2:
A 21 cm HI map of NGC 7714/5 (color) (from
Smith, Struck, and Pogge 1997),
with superimposed contours
from a smoothed optical images from the
Digitized Sky Survey.
Note the large HI loop to the west, coincident with the optical tail,
as well as the offset between the gas and the stars in the bridge.
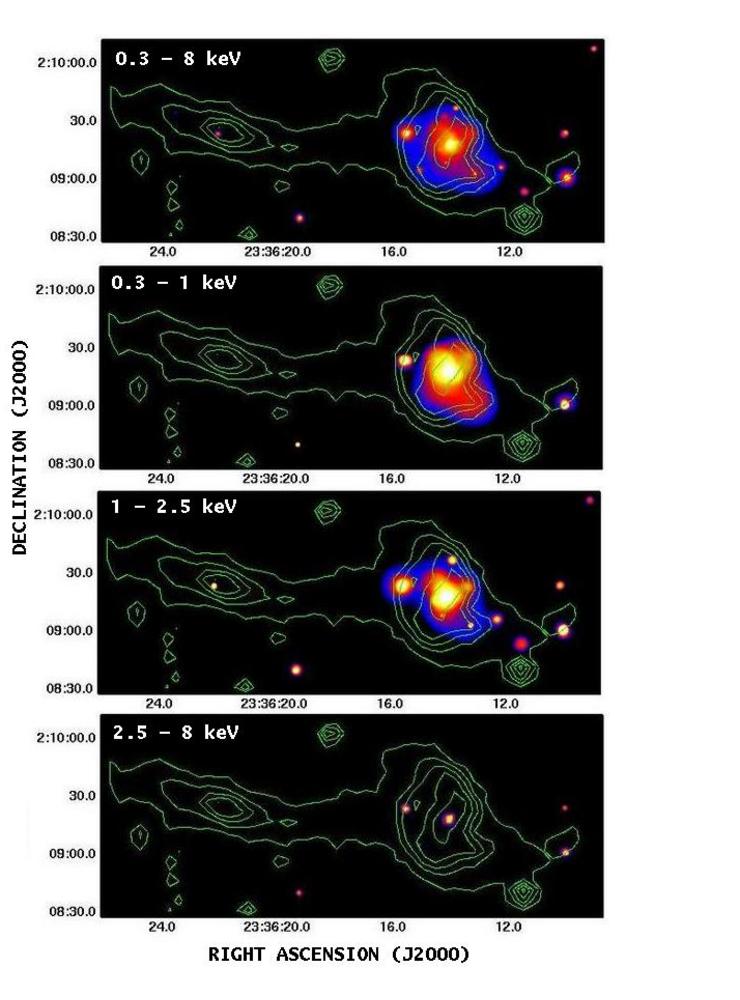
Figure 3:
The smoothed Chandra maps of NGC 7714/5 in various energy ranges,
with optical Digitized Sky Survey contours.
Top: 0.3 - 8 keV,
created using a weighted exposure map.
Second from top: 0.3 - 1 keV,
created using a monochromatic 0.8 keV exposure map.
Third from top: 1 - 2.5 keV,
created using a monochromatic 1.5 keV exposure map.
Bottom: 2.5 - 8 keV,
created using a monochromatic 3.0 keV exposure map.

Figure 4:
The smoothed 0.3 - 8 keV Chandra map, with
the
H-alpha contours from Smith et al. (1997) superimposed.
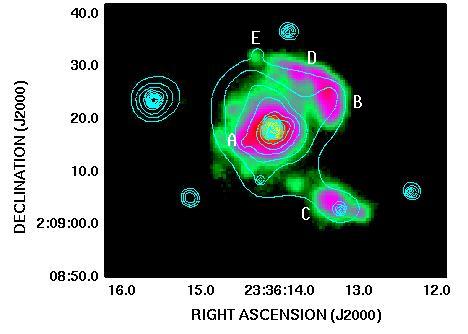
Figure 5: An overlay of the Chandra X-ray
contours on the inner portion of the H-alpha map.
Note again the X-ray
counterparts to the three HII region complexes southwest,
north, and northwest of the nucleus. Note
that there is a second HII region complex
between the northern and northwestern one
that does not have an X-ray counterpart,
in spite of the fact that it is brighter
in H-alpha than the northern HII region.
Thus the observed H-alpha/X-ray ratio varies along that chain
of HII regions.
Note also that the ULX to the southwest
of the nucleus is offset from the
middle of the HII region.
Note also that there is a slight extension
to the north of the nucleus; this may be caused
by a wind. It may have a faint H-alpha counterpart.

Figure 6:
An overlay of the X-ray contours on the HST F606W PC map, after
registering the HST map so that the brightest X-ray source
is coincident with the brightest optical source.
Note the X-ray counterparts to the HII regions to the northwest, northwest,
and southeast of the nucleus.
There are no obvious optical counterparts to the four
candidate ULX sources in the field.
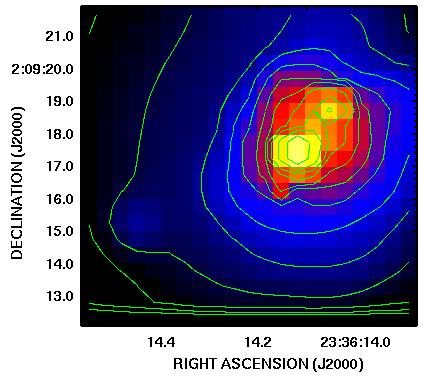

Figure 7:
a) Left: A close-up view of the inner 10" of the Chandra 0.3 - 8 keV map
(both contours and color).
Notice the second point source 1.5" northwest of the nucleus.
b) Right: The Chandra contours for the inner 10", superimposed on the archival
HST F606W image. Note the bright optical point source within 1 Chandra
pixel of the secondary X-ray source.
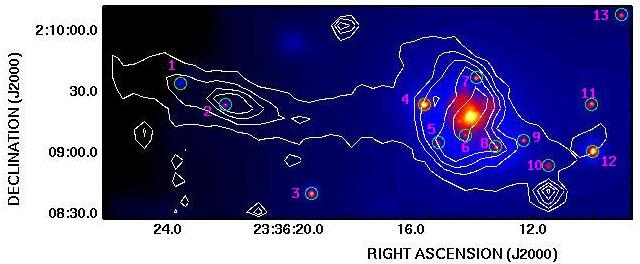
Figure 8:
The smoothed 0.3 - 8 keV Chandra exposure-map-corrected map (colors)
with point sources marked. These point sources were selected
by the CIAO WAVDETECT routine.
The contours are from the optical Digitized Sky Survey.
Note that sources 4 and 12 are very bright.
Interestingly, source 12 was very faint in the 2002 XMM-Newton
observations of Soria and Motch (2004), with a brightness
comparable to the other point sources in the field. Its X-ray luminosity
has increased by a factor
of about 10 in these Chandra observations.
Sources 8 and 9
appear associated with the inner western tail (and HII regions: see above).
Sources 10, 11, and 12
may (or may not) be associated with the outer western tail.
Source 1 appears associated with the western NGC 7715 tail,
while source 2 appears to be in the disk of NGC 7715.
Sources 3 and 13 are likely background objects.
No X-ray counterpart to the
Type Ib SN 1999dn was detected.
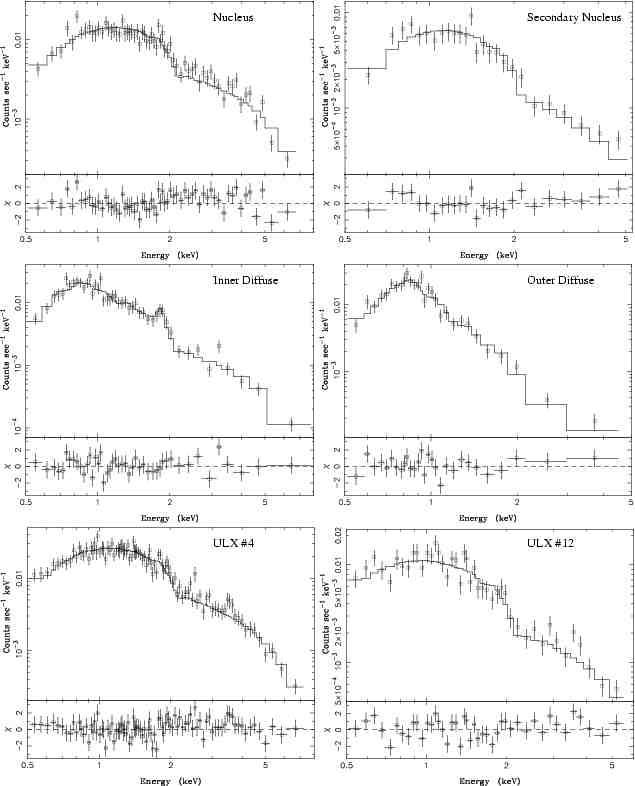
Figure 9: The background-subtracted Chandra
spectra (datapoints), best fit spectral fits (solid
lines), and residuals (dotted lines).
See text for more details.
To return to Beverly Smith's web page, click
here.
Other related papers about NGC 7714/5 that we have written:
-
Struck and Smith (2003),
Models of the Morphology, Kinematics,
and Star Formation History of the Prototypical Collisional
Starburst System: NGC 7714/5 = Arp 284, ApJ, 589, 157.
-
Smith and Struck (2001),
New Observations of Extra-Disk Molecular Gas in Interacting
Galaxy Systems, Including a Two-Component System in Stephan's Quintet,
AJ, 121, 710.
-
Smith, Struck, and Pogge (1997),
Atomic Hydrogen and Star Formation in the Bridge/Ring
Interacting Galaxy Pair NGC 7714/7714 (Arp 284),
ApJ, 483, 754.
-
Smith and Wallin (1992),
The Evolutionary History of the Interacting Galaxy System NGC 7714/7715
(Arp 284), ApJ, 393, 544.
-
B. W. Peterson, C. Struck, B. J. Smith, and M. Hancock (2009),
Star Clusters in the Interacting Galaxy System Arp 284,
M.N.R.A.S., submitted
For my Chandra images of the interacting galaxy group NGC 4410,
click
here.
The paper on the Chandra NGC 4410 observations is published
as
Smith, Nowak, Donahue, and Stocke (2003), AJ, 126, 1763.
Last updated: 6/15/09