SPITZER/
SARA
IMAGES OF
THE INTERACTING PAIR ARP 82 (NGC 2535/6)
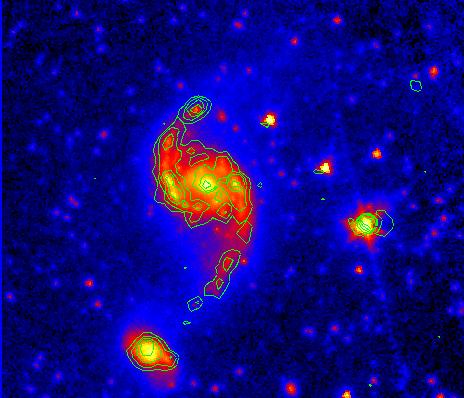
Left: Spitzer IRAC band 1 (3.6 microns) of Arp 82 (color) with SARA H-alpha
contours superimposed.
These Spitzer observations were made November 1, 2004.
North is up and east is to the left.
There are some residuals on the H-alpha map around the bright
stars in the field.
Right: Spitzer IRAC band 1 (color) with SARA R-band
contours superimposed.

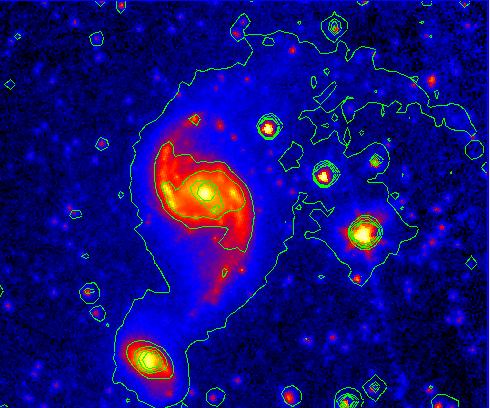
Left: An overlay of the Arp 82 H-alpha contours on the Spitzer IRAC band 4 (8.0 microns) image.
Note the H-alpha concentration way out in the northern tail
that has a faint counterpart at 8 microns.
Note also that there are a few other
8 micron concentrations along the tail not seen
in the H-alpha map. These knots are also visible in the
Arp Atlas (1966)
photograph.
Right: SARA R-band contours on the Spitzer band 4 image.
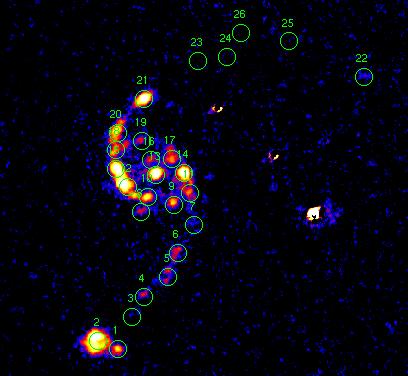
The SARA H-alpha image of Arp 82 with 26 HII region complexes selected
by eye from the images.
The labels are directly above the given HII region.
North is up and east to the west.
Source #22, at the end of the northern tail, is
detected in H-alpha, source #25 is marginally
detected, while sources #23, #24, and #26 are not detected. This is
consistent with the H-alpha map of Amram et al. (1989).
Sources #23, #24, and #26
are visible in the Spitzer IRAC 8.0 micron image.
The three bright regions to the right of the main
galaxy are artifacts caused by imperfect
continuum subtraction of bright stars.
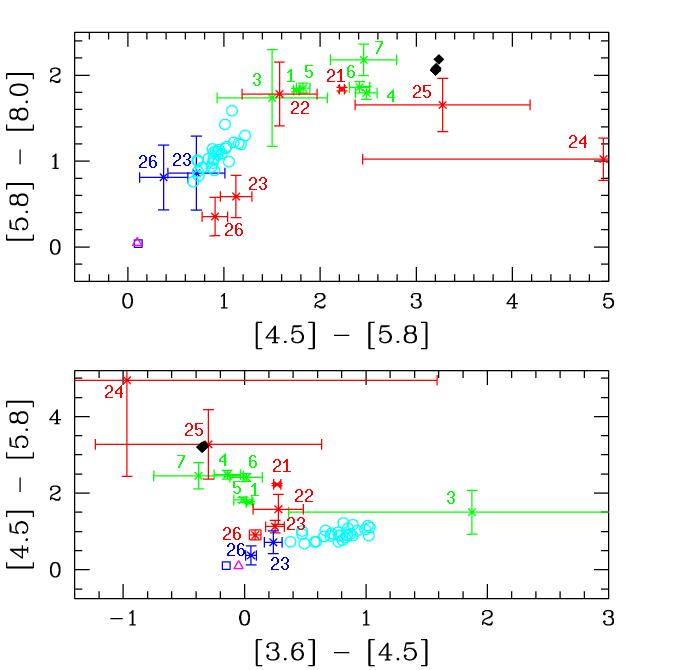
The Spitzer IRAC colors for the clumps in the tidal features of Arp 82.
The red crosses mark the locations of the clumps in the northern
tidal arm, while the green crosses are the clumps in the bridge.
These clumps are labeled.
This plot also contains the colors of M0III stars (open dark blue square)
(from Cohen and Megeath 2004, in Pahre et al. 2004a)
and the mean colors for the field stars in Whitney et al. (2004)
(magenta triangle). The black diamonds mark the predicted
values for the Li and Draine (2001) dust models, for
a very large range of interstellar radiation field intensities.
The light blue circles show the locations of the Sloan Digitized Sky Survey
quasars in the Spitzer Wide-Area Infrared Extragalactic Survey (SWIRE)
Elais N1 field (Hatziminaoglou et al. 2005). These quasars have
redshifts between 0.5 and 3.65; since their spectral energy distributions
are power laws, their infrared colors do not vary much with redshift.
The photometry was done using the IRAF daophot routine,
with 4.1 pixel (5") radii apertures (as shown in the above figure).
Only statistical errors are plotted, determined
from the rms in the sky annulus. No color corrections
were made.
Aperture corrections were included, although they
have only a tiny effect on the IRAC colors
of these clumps.
As given in the IRAC Data Manual,
the aperture corrections
are 1.06, 1.06, 1.07, and 1.09 for IRAC bands 1 - 4, thus
the colors change very little
([3.6] - [4.5] by 0.0 magnitudes, [4.5] - [5.8] by 0.01 magnitudes,
and [5.8] - [8.0] by 0.02 magnitudes.)
The sky was determined using the
mode in an annulus surrounding the source, with an inner radius
of 5 pixels and an outer radius of 10 pixels.
For the fainter clumps, the determination of the sky
is critical, and required
much experimentation because of confusion and a strong sky gradient
in the 5.8 micron image.
To show the effect of the sky subtraction, we also plot the locations
of two of the fainter clumps, clumps #23 and #26, when the
sky is determined using the median
of the counts in an annulus with inner radius of 5 pixels and
an outer radius of 8 pixels (blue crosses).
Note that the position of these two faint clumps on the plots shifts
somewhat with the different sky determination.
Most of these clumps:
- Have [3.6] - [4.5] colors similar to the colors of stars,
implying
these bands are dominated by starlight.
-
Have [4.5] - [5.8] colors between those of the ISM
and stars, indicating contributions from both to this color.
- Have [5.8] - [8.0] colors similar to those of the ISM,
indicating that these bands are dominated by dust emission.
- Have colors similar to those of most of the clumps
in Arp 107:
see the
Arp 107 web page.
These are some outlying data points, however.
- Clumps #23 and #26, in the northern tail,
are bluer than the other
clumps in [4.5] - [5.8] and [5.8] - [8.0], with colors
between those of quasars and stars.
Thus these may be foreground stars, background quasars,
or old star clusters in the tail.
- In contrast, clumps #24 and #25, which are also in the
northern tail, have colors similar to those of ISM (but with
large uncertainties). Thus these appear to be very young
star formation regions with little underlying old stellar
population.
This plot shows the locations of all the clumps identified
in the above H-alpha image. The red crosses are the bridge and tidal
clumps (as in the above color-color plot), while the green crosses
are the clumps in the main disks.
Note that the colors of the clumps in the main disks are all quite
similar,
with:
- [3.6] - [4.5] colors like those of stars.
- [4.5] - [5.8] colors between those of stars and the ISM.
- [5.8] - [8.0] colors like those of the ISM.

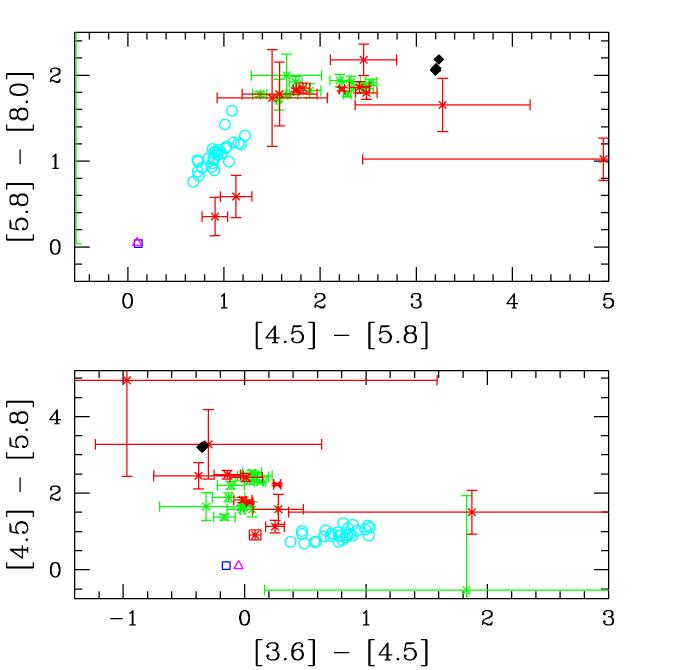
Here is a comparison between the Arp 82 clumps (green crosses)
and the Arp 107 clumps (red crosses)
(see the Arp 107 web page
located
here).
Although the majority of clumps
in both galaxies have [3.6] - [4.5] colors
similar to those of stars, there
are
differences in their other colors:
- The Arp 107 clumps tend
to have bluer [4.5] - [5.8] colors
than the Arp 82 clumps, that is,
the Arp 82 clumps tend to have younger
populations on average.
- Some of the Arp 107 clumps are bluer
in [5.8] - [8.0] than the
majority of Arp 82 clumps.
As noted in
the
Arp 107 web page, some of
these may be foreground stars.
Except for clumps #23 and #26 discussed
above,
all of the clumps in Arp 82 appear to
be star forming regions.
The less energetic star formation regions in Arp 107 than in Arp 82
is consistent with their IRAS properties.
Here is a table of their global properties
compared to the median values in his Arp Atlas interacting galaxy sample
(following).
The far-infrared and blue values are from Bushouse et al. (1988).
The
the H-alpha value for Arp 107 is from our work
(via the
Keel (1985) small-aperture photometry)
and
includes the Seyfert nucleus,
while the H-alpha value
for Arp 82 is from our SARA observations (calibrated by two standards,
Hz 14 and Hiltner 600, which agree within 21%). The H-alpha luminosity has been roughly
corrected for [NII] in the filter by assuming H-alpha/NII ~ 3.
| Pair | log L(B) | log L(FIR) | log L(FIR)/L(B) | log F(60)/F(100) | log L(H-alpha) | log L(FIR)/L(H-alpha) | log L(H-alpha)/L(B) |
| Arp 107 | 9.85 | 10.1 | 0.20 | -0.73 |
41.0 | 2.68 | -2.48 |
| Arp 82 | 9.67 | 10.2 | 0.50 | -0.50 |
41.6 | 2.27 | -1.75 |
| Bushouse interacting galaxy median | 9.28 | 10.1 | 0.75 | -0.33 | 41.2 | 2.68 | -1.77 |
The far-infrared luminosities of Arp 82 and Arp 107
are similar to the median
for the Arp Atlas interacting systems, however,
their L(FIR)/L(B) and L(60)/L(100) ratios are lower than the median.
Note that Arp 107 is lower in L(FIR)/L(B) and L(60)/L(100) than Arp 82,
implying a lower normalized star formation rate. This is consistent
with the older stellar population implied by the Spitzer colors above.
The far-infrared-to-H-alpha ratio for Arp 107 is similar to
the median for other Arp galaxies, but this galaxy is deficient in
H-alpha (and far-infrared) compared to the blue luminosity, for the
Arp galaxies in the Bushouse et al. (1988) sample. Thus it has an older
stellar population.
For Arp 82, the FIR/H-alpha ratio is slightly lower than the median
vs. other Arp galaxies, but not extreme compared to the other galaxies
in the Bushouse et al. (1988) and Kennicutt et al. (1987) papers.
Our H-alpha flux for each of the two galaxies
in Arp 82 is a factor of ~3.5 times lower than the Kennicutt et al. (1987) values.
Our flux appears more likely correct, since with the Kennicutt et al. (1987) value,
Arp 82 would be very extreme in having a very high
H-alpha luminosity compared to its far-infrared luminosity.
We also compared our fluxes with the 4.7" diameter aperture measurements of
Keel et al. (1985). Our flux for A is 2.2 X smaller than Keel's values,
while our flux for B is 1.5 X larger. The Kennicutt total fluxes applied to
our images would give
much more discrepant fluxes, thus again our values seem more reliable.
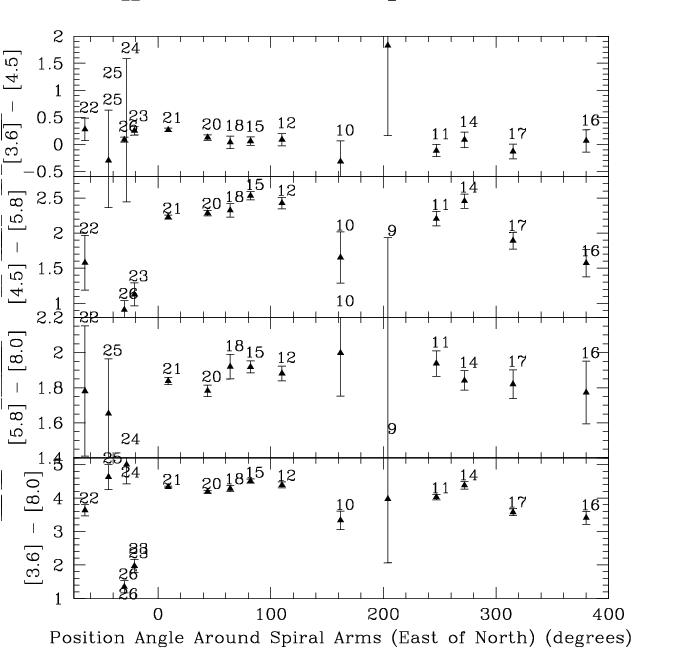
For the clumps in the northern tail of Arp 82 and along the two bright spiral
arms in the disk, this plot shows the IRAC colors vs. the position
angle (measured east of north, with the clumps in the northern tail
at negative position angle, and clump 16 at P.A. = 380 degrees.
This plot shows:
- All of the clumps have [3.6] - [4.5] colors
similar to those of stars (0.0 +/- 0.5 magnitudes).
- The [4.5] - [5.8] colors are generally
very red (i.e., very `starbursty'),
except for the two low S/N clumps in the tail, #23 and #26.
- The [5.8] - [8.0] colors are all between ~1.8 and 2, similar
to that of the ISM. Thus these bands are dominated by
interstellar matter.
- The [4.5] - [5.8] colors are typically redder than
those in Arp 107, indicating younger stellar populations
on average
(see the Arp 107 web page.)
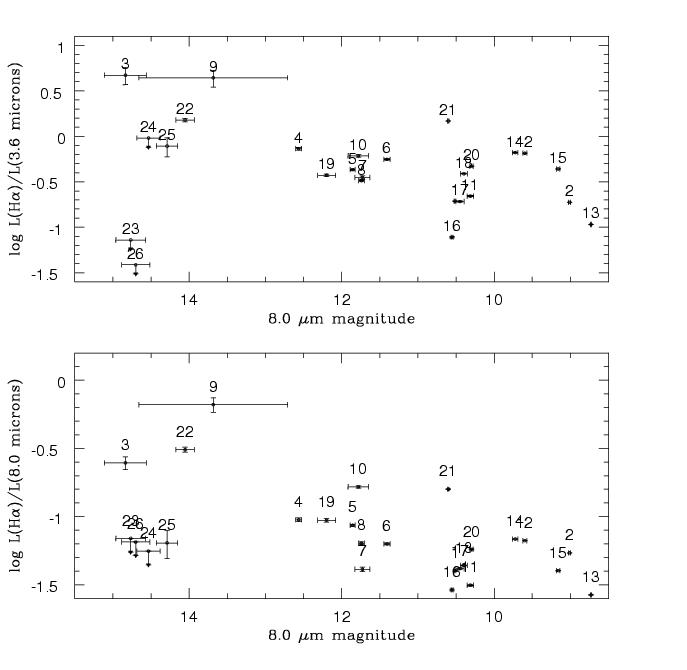
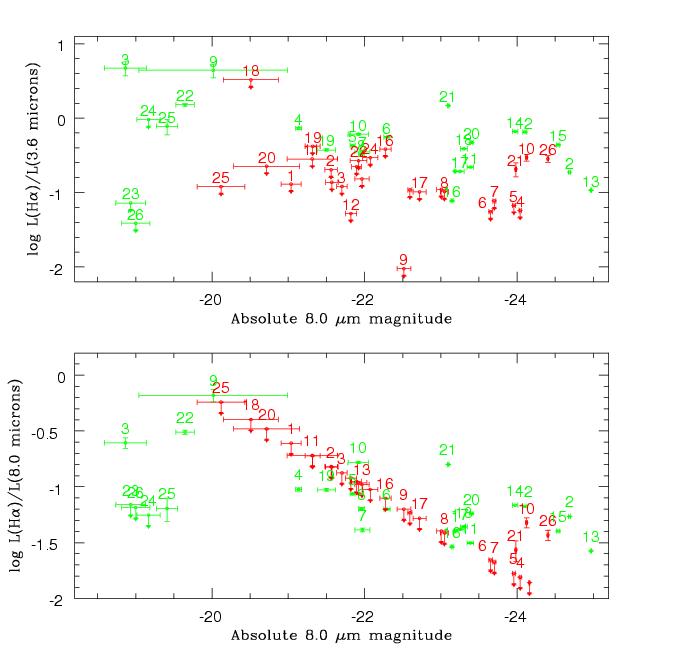
Top: the ratio of the H-alpha luminosity to that at 3.6 microns,
plotted against 8.0 micron magnitude,
for the 26 selected star formation regions in Arp 82.
Bottom: the ratio of the H-alpha luminosity to that at 8.0 microns,
plotted against 8.0 micron magnitude.
The H-alpha map was roughly calibrated using the large-aperture
photometry of Kennicutt et al. (1987).
Note that there is considerable scatter in both ratios,
even in L(H-alpha)/L(8.0), in spite of the fact
that both
H-alpha and 8 microns trace star formation.
Note that HII region #22 (at the end of the northern tidal tail)
and region
#3 (in the bridge near NGC 2536) have
significantly higher H-alpha/mid-infrared ratios than the other
sources. Clump #9, in the southwestern corner of the main disk,
also has a high H-alpha/mid-infrared ratio.
Note also that the upper limits
on the H-alpha to 8.0 micron ratios for the other clumps in
that tail are consistent with those for the detections (lower panel),
thus those clumps are not unusually deficient in
H-alpha relative to 8.0 microns. However, sources #23 and #26 are deficient
in H-alpha relative to 3.6 microns (top panel), again indicating that
they are in a different evolutionary state than the other sources.
Only statistical errors are plotted.
The total H-alpha luminosity of Arp 82 is 4.1 X 10^41 erg/s, from our
SARA observations.
(Kennicutt
The total 3.6, 4.5, 5.8, and 8.0 magnitudes of Arp 82
are 9.25, 9.31, 7.75, and 5.93, respectively, thus the total
log L(H-alpha)/L(8 microns) = -1.4 and log L(H-alpha)/L(3.6) = -0.9.
For the brighter galaxy in the pair,
log L(H-alpha)/L(8 microns) = -1.5 and log L(H-alpha)/L(3.6) = -0.9.
For the fainter galaxy,
log L(H-alpha)/L(8 microns) = -1.4 and log L(H-alpha)/L(3.6) = -0.9.
These global values are considerably lower than the values for the
clumps in the plot (see above).
The fraction of the emission that is in the clumps
in H-alpha is 66%, compared to 29% at 3.6 microns and 41% at 8.0 microns.
In other words, there is more diffuse emission in the infrared than
in H-alpha, with 34% diffuse
in H-alpha, vs 71% at 3.6 microns and 59% at 8 microns.
This H-alpha diffuse fraction is similar to that seen in spiral
galaxies (e.g., Thilker et al. 2002).
The 3.6 micron diffuse
fraction is so high because this wavelength traces the older stellar population,
which isn't as confined to star forming regions.
The difference in diffuse fraction between the H-alpha and 8 microns is likely due
to PAH emission outside of the main star forming regions, perhaps
because of heating of these grains by non-ionizing photons.
For comparison, for the quiescent
spiral NGC 7331 log L(H-alpha)/L(8 micron) = -1.8
(from the Young et al. 1996 H-alpha measurement and the Regan et al.
2004 Spitzer data), compared to -1.4 for Arp 82 and -2.1 for
Arp 107.
A comparison of the H-alpha/Spitzer ratios for the clumps in
Arp 82 (green) and Arp 107 (red)
(see the Arp 107 web page.)
Note that, on average, the H-alpha/3.6 micron ratios for the clumps in Arp 107 are
lower than those in Arp 82.
The 3.6 micron luminosity
of Arp 107 (which approximately traces the stellar mass)
is higher than that of Arp 82 by about a factor
of four
(2.5 X 10^42 erg/s
and 6.2 X 10^41 erg/s for Arp 82 A and B, respectively, vs.
8.0 X 10^42 erg/s and 4.9 x 10^42 erg/s for Arp 107 A and B).
However, in general, Arp 107 has a much lower star formation rate per mass
than Arp 82. The 8.0 micron to 3.6 micron flux ratios for
Arp 82 A and B are 5.0 and 4.4, respectively, while for Arp 107 A and B
they are 1.75 and 0.31. Thus Arp 107 has an older stellar population
on average. This is consistent with the redder [4.5] - [5.8] colors
for the clumps in Arp 82.
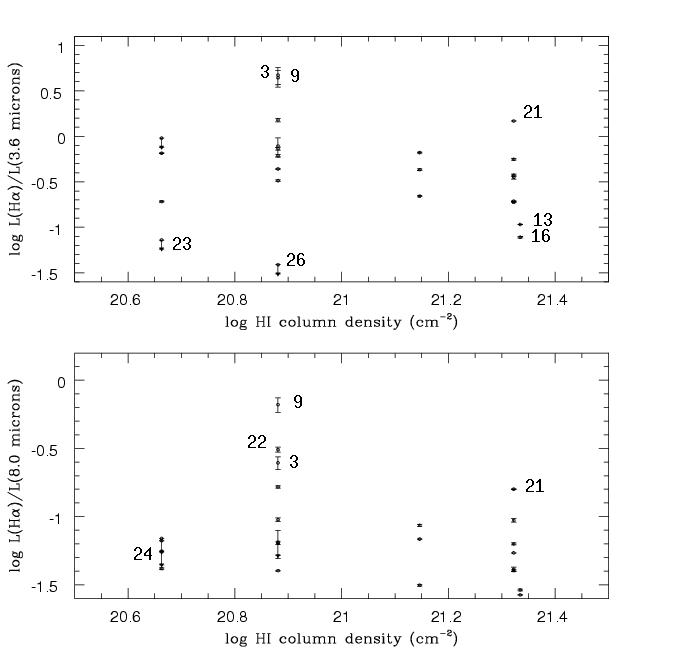
To test whether the variations in L(H-alpha)/L(3.6 microns) and
especially L(H-alpha)/L(8.0 microns) are due
in part to extinction of the H-alpha emission,
we plotted these ratios against the hydrogen column
density in the above figure. The HI column density was estimated by eye
from the Kaufman et al. (1997) HI map. For the positions from
which CO was detected by Kaufman et al. (1997), a second component was
included, assuming the standard Galactic ICO/NH2 ratio
(Strong et al. 1988).
No strong correlation is seen in either plot.
Possible very weak anti-correlations may be present, especially in
the L(H-alpha)/L(8.0 microns) plot, in that the regions with
lower column density tend to have higher
L(H-alpha)/L(8.0 microns) ratios.
The slope of the observed trend is consistent with that expected from
the Bohlin, Savage, and Drake (1978) Galactic N(H)/A(V)
ratio.
There is, however, a lot
of scatter in this plot, suggesting that some of the variations in
the L(H-alpha)/L(8.0 micron) ratios are intrinsic.
In particular, note that #3, #21, and #22 have high H-alpha/8.0 micron
ratios relative to the gas content.
Repeating this analysis
with more exact HI values from an electronic version of the HI map and
using H-alpha/H-beta emission line ratios or extinction estimates
based on optical/near-infrared colors would be worthwhile.
Based on the above, the tail/bridge sources divide into four
groups:
1) #3, #21, #22: excess H-alpha flux vs. 3.6 and 8.0 microns, not due
just to extinction.
2) #23 and #26: low star formation relative to stellar mass, as indicated
by both H-alpha and the infrared colors. Possibly background quasars or foreground
stars.
3) #4, #5, #6: more like the star formation regions in the
disk, but with a somewhat high dust-to-stellar continuum ratio
(higher [4.5] - [5.8] ratio) (thus less underlying old stellar population?).
4) #7, #24, and #25: not enough information (undetected at several bands).
Last updated: 4/28/05 by B. J. Smith