Beverly Smith
Department of Physics and Astronomy,
East Tennessee State University.
Our Sun is a relatively stable star,
and does not vary much in brightness.
Many of the other stars in the sky are not constant, but
vary dramatically in brightness with time, sometimes by a factor of 1000 or
more in brightness.
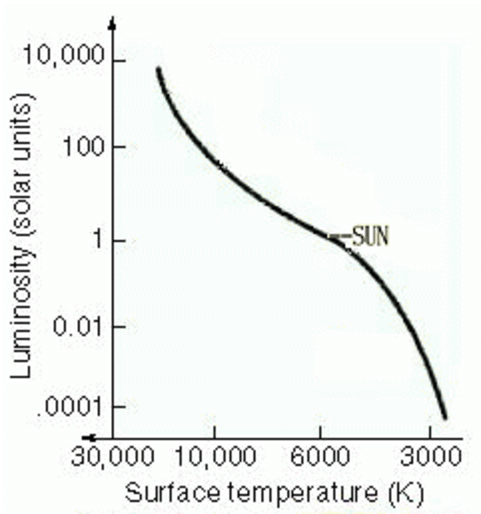
An Hertzsprung-Russell (H-R) Diagram,
a plot of the surface temperature of a star vs. its luminosity
(total energy emitted per second).
The diagonal strip down the middle of this chart is the
main
sequence.
In the core of main sequence stars,
hydrogen fusion is occuring, producing helium.
Our Sun is currently a main sequence star, in the middle of the range of temperature and luminosity.
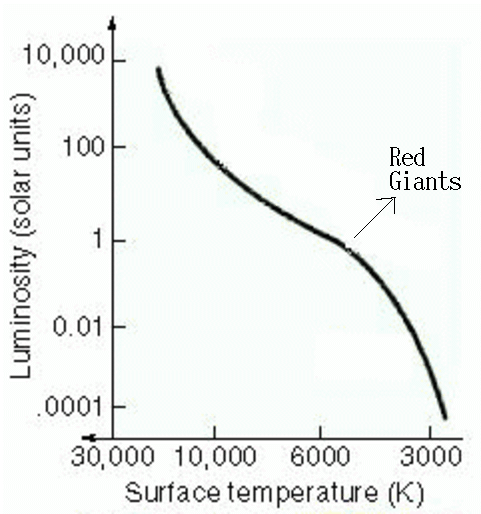
After the hydrogen in the core of
our Sun runs out, in about 5 billion years or so,
the outer layers
of the Sun will expand
and cool off, and the Sun will become a
luminous
red giant star.
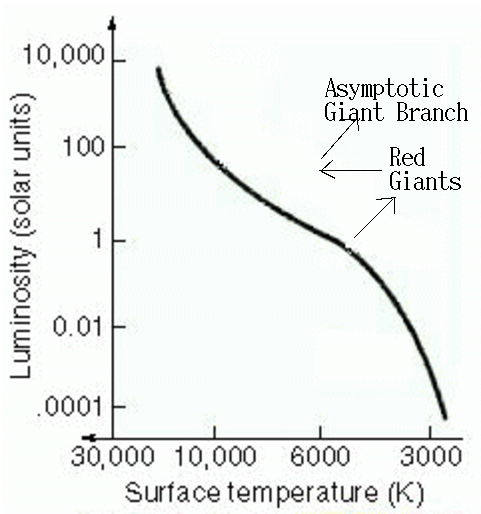 At the same time the outer layers of the
star are expanding, the core of the star is shrinking and getting
hotter. Eventually it gets hot enough for a new nuclear region
to occur: helium fusion.
This new source of energy stabilizes the star,
and the outer layers contract back in and heat up, and the star
moves back to the left on the H-R diagram, to hotter temperatures.
But the helium doesn't last forever.
When it runs out, the star will again expand even larger,
and get even more luminous. The star moves
up to the right
on the H-R diagram. This section of the H-R diagram is called
the Asymptotic Giant Branch (AGB).
AGB stars are often pulsating, changing their sizes
rapidly with time.
At the same time the outer layers of the
star are expanding, the core of the star is shrinking and getting
hotter. Eventually it gets hot enough for a new nuclear region
to occur: helium fusion.
This new source of energy stabilizes the star,
and the outer layers contract back in and heat up, and the star
moves back to the left on the H-R diagram, to hotter temperatures.
But the helium doesn't last forever.
When it runs out, the star will again expand even larger,
and get even more luminous. The star moves
up to the right
on the H-R diagram. This section of the H-R diagram is called
the Asymptotic Giant Branch (AGB).
AGB stars are often pulsating, changing their sizes
rapidly with time.
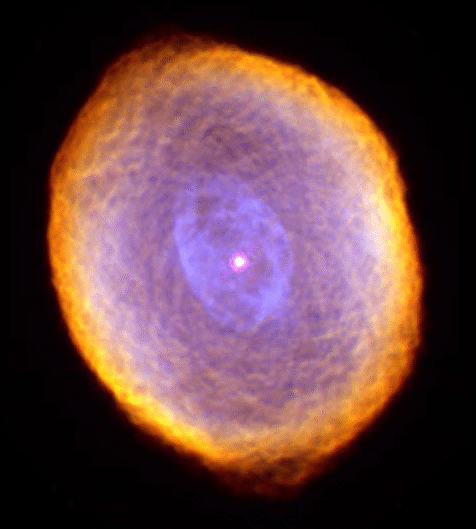
A
Hubble
Space Telescope image of the IC 418 planetary
nebula
(the Spirograph Nebula).
Eventually AGB stars will completely
blow off their outer layers and become planetary nebula,
like the one shown here.
Planetary nebula are simply shells of
ejected gas clouds surrounding the hot inert cores of dead stars.
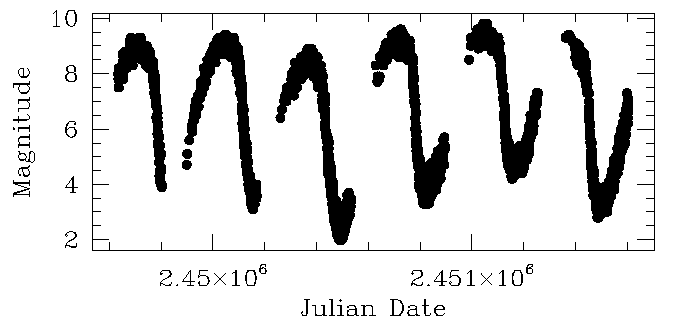
Perhaps the best-known type of AGB stars are the Mira variables, named after the star Mira
in the constellation of Cetus. This is a plot of the visual brightness
of Mira as a function of time for a five year period.
This plot came from data from the
American Association of Variable
Star Observers (AAVSO).
A Mira variable
is a star whose brightness varies by at least a factor of 10 (i.e., a magnitude change of
at least 2.5),
with a period
of between 100 and 1000 days.
As can be seen in this plot, Mira variables are not perfectly regular;
their periods can vary a bit with time, as can their maximum and minimum brightnesses.
Mira variables are often surrounded by
shells of dust. This dust is produced
in the cool outer layers and blown
outwards by radiation pressure from the
star.
This dust can be observed
directly at infrared wavelengths.
To investigate how this dusty circumstellar shell
varies with changes in the photosphere of
the star, it is important to observe variations
in the infrared brightnesses of the star,
and compare with changes in visible light.
To this end, we extracted infrared
light curves for a sample of 38 Mira
variable stars from the archives of the
Diffuse Infrared Background Experiment (DIRBE)
instrument on the
Cosmic Background Explorer (COBE) satellite.
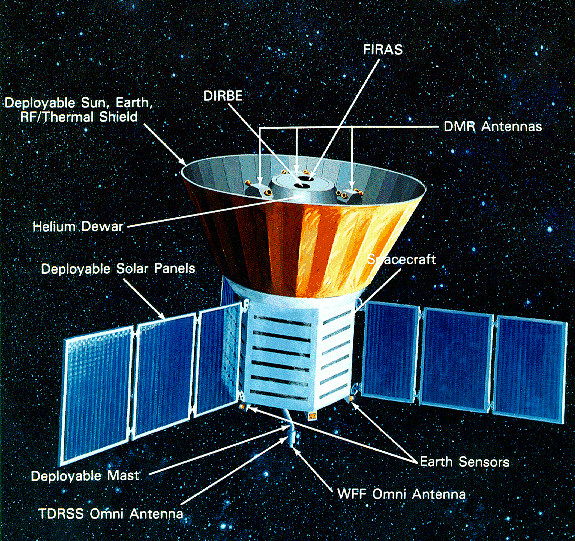
The
Cosmic Background Explorer (COBE) satellite.
This
NASA infrared satellite
was designed to study the Cosmic Background Radiation. It also detected
many AGB stars, since these stars are extremely bright at infrared wavelengths.
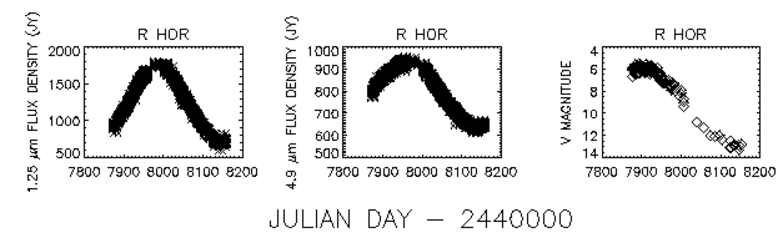
COBE light curves for the
mira variable R Hor at two infrared wavelengths,
1.25 microns (near-infrared)
and 4.9 microns (mid-infrared), compared to that in the visual.
Note that the amplitude of variation is less at 1.25 microns than
in the visual, and even less at 4.9 microns.
In general, we found that, for Mira variables, as the wavelength
increases, the amplitude of variation decreases.
This is consistent with theoretical models of circumstellar
shells around Mira variables.
Also note that the peak brightness in the
infrared occurs later
than that in the visual.
Also note that
the peak in the mid-infrared
(at JD = 2447959)
occurs slightly before than
(JD = 2447987), but still after that
in the visible (JD = 2447934).
Similar lags
were also found in a few
other stars in the sample.
The near-infrared-to-visible lag
can be explained by variations in
the strength of various molecular absorption
features in the atmosphere of the star,
because different molecules form at different
depths in the atmosphere. At present,
the time offset between the mid-infrared
and near-infrared maxima is unexplained.
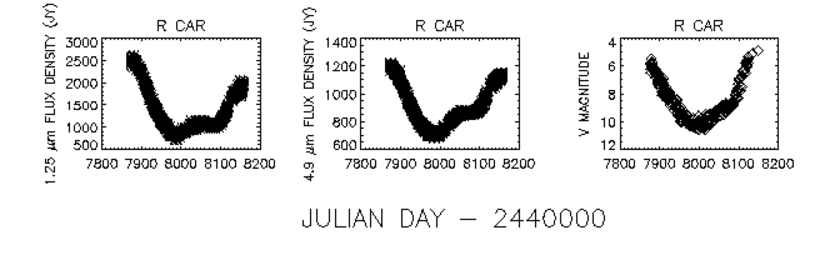
COBE 1.25 microns and 4.9 micron light curves for R Car, compared
to those in the visual.
Note again the decreasing amplitudes with increasing wavelength.
Also note the inflection points in the rising
portion of all three light curves.
The simultaneous observations of secondary
maxima at infrared and optical wavelengths
supports the hypothesis that these features
are caused by shock waves in the stellar
atmosphere, rather than newly formed dust
layers in the shell, an alternative
hypothesis.
For more information and more light curves,
see
Smith et al. 2002, Astronomical Journal, volume 123, 1411.