Computer Organization and Design Fundamentals by David Tarnoff is now available!Although the set of notes you have requested is presented below, it has not been maintained since January, 2003. All of the information in these notes has been included in an on-line text titled Computer Organization and Design Fundamentals. The book is available in three formats, two of which are free electronic downloads. Please visit one of the following links in order to access the format you prefer.
Thank you for your interest in this textbook. Please feel free to e-mail me at tarnoff etsu.edu if you have any questions or comments. -Dave Tarnoff Another State Diagram ExampleImagine a light bulb circuit that is controlled by a push button. You push the button, and the light bulb turns on. Release it, it stays on. Push the button a second time, and the bulb turns off. Release the button, and it stays off. This "enhanced" light bulb state diagram is shown below. 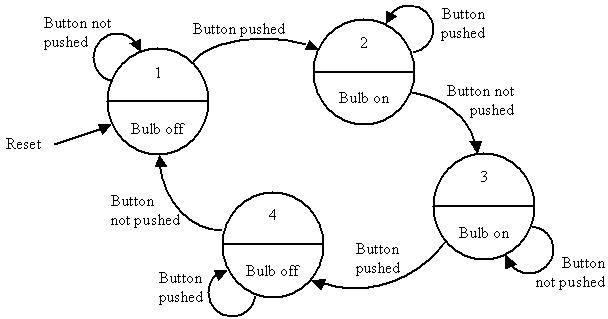
The states are as follows:
This seems like an awfully complex state diagram for such as simple procedure, but it has taken into account every possibility for the design of this circuit. Now, we need to design the circuit. As you know, the design of a synchronous state machine involves combinational logic to determine the next state and the output from the current state and the input, flip flops to maintain the current state value, and a clock to force the state changes when they are necessary. The figure below represents a sample timing diagram for the operation of this circuit. It is just one way the circuit could operate for a particular sequence of button presses. I present it here for those of you that are having trouble understanding the flow of the state diagram. 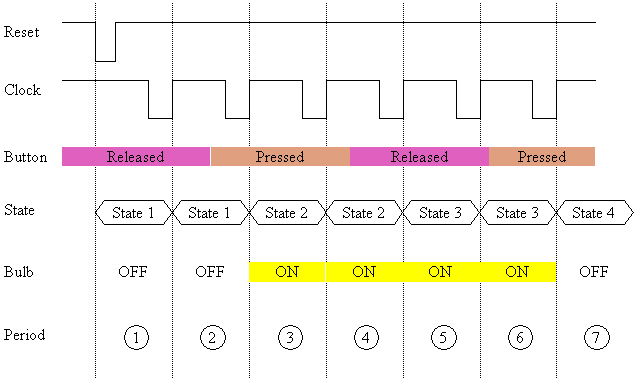
Note first that the periods are just something that I added to the figure to help you understand the process of the state machine. Each period begins when something forces the state to change, either a reset or a rising edge to the clock. This implies that the state of a system changes only when a clock pulse moves us to the next state or a reset forces us back to the initial state. In period 1, the reset signal has returned the state of the system to State 1. The output of the bulb at this point is off. When a clock pulse occurs, it moves us into period 2. Looking at our state diagram, we see that the only thing that moves us out of State 1 is if the user presses the button. When the clock rises between period 1 and 2, the button is released, therefore we stay in State 1. The bulb is still off. For the next clock pulse, moving us into period 3, the button is pressed. From our state diagram, we see that this will move us into State 2. The output of this state has the bulb on. The next clock pulse moves us into period 4. The button is still pressed, so we remain in State 2. In period 5, the clock pulse rises when the button is released. This moves us into State 3. The output from this state has the bulb on. In period 6, the clock rises while the button is still released. The only thing that takes us out of State 3 is pushing the button, so we remain in State 3. The clock pulse that moves us from period 6 to period 7 occurs when the button is pressed. Examining State 3 on our state diagram reveals that this will move us into State 4, the output of which has the bulb off. Flip-flop ReviewLet's refresh our memory on flip-flops. In general, the flip-flops we will be using match the diagram below. 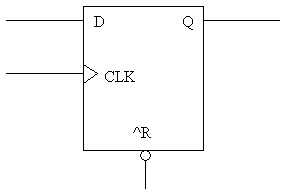
It has three inputs (D, CLK, and ^R) and one output (Q).
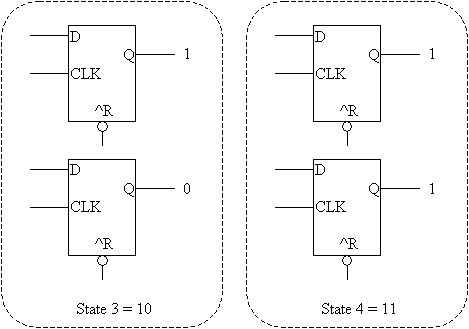
Using Flip-Flops to Define Our StatesLet's begin by numbering our states so that we can find a Boolean representation for them.
From this table, we can see that it takes 2 digits to represent all of the states. This means that we can use two flip-flops to represent the state of the machine. The figures below show each possible state represented with two flip-flops. 
Next-State Truth TablesThe next step in our journey toward designing the logic for this system is to take the information we have in the state diagram and turn it into a truth table. Just like all of our previous truth tables, the left-hand columns are going to be for our inputs and the right-hand columns are going to be for outputs. There is a major addition to our truth tables here: the "next state" will be added as one of the outputs of the table. In other words, from a certain set of inputs, we should know what the next state of the state machine will be. For example, if the current state is 1 and the input is button released, the next state is 2. The table for our example is shown below. Note that Button Input equals 0 for released and 1 for pushed and Output equals 0 for bulb off and 1 for bulb on.)
Great! Now we have a truth table. Actually, we have three truth tables: one for bit 1 of the next state, one for bit 0 of the next state, and one for the output.
Now we can convert each of these tables to a Karnaugh map. (Pause while I wait for collective groan to pass...) Note that I've changed the input variable for the button to the letter B. 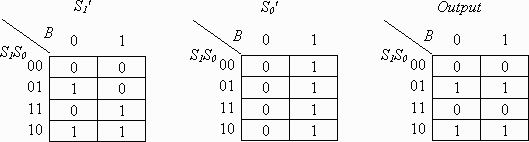
Then we do our rectangles. 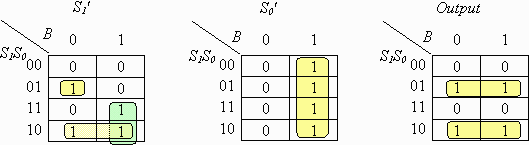
And from these, we can derive the SOP expressions. 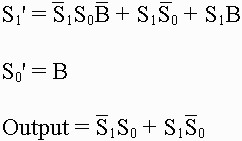
Lastly, this gives us the logic circuit below. 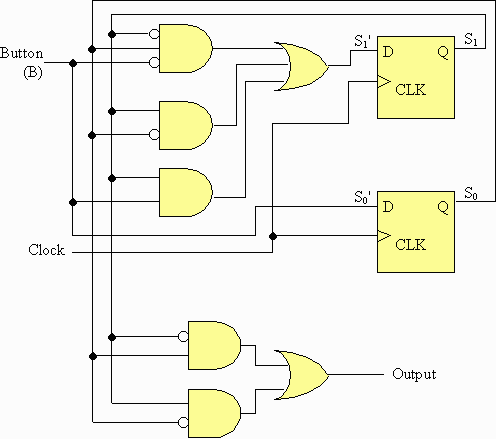
Copyright © 2001 by David L. Tarnoff. All rights reserved. | |||||||||||||||||||||||||||||||||||||||||||||||||||||||||||||||||||||||||||||||||||||||||||||||||||||||||||||||||||||||||||||||||||||||||||||||||||||||||||||||||||||||||||||||||||||||||||||||||||||||||||||||