WSJ Quotes – Stocks, Bonds, Mutual
Funds, and Currencies
General
Stock Information
1) DJIA is the Dow Jones Industrial Index which
is composed of 30 large industrial stocks.
It is a price weighted index and involves adding up the prices of the
stocks and dividing by a denominator.
There is also a Dow Jones Transportation Index(20 stocks) and a
Utilities Index(15 stocks).
2)
The New York Stock Exchange is an actual trading floor located on Wall
Street. There is also the American Stock
Exchange, also in New York, the Nasdaq Exchange(computer network), and 5
regional exchanges, the large regional ones being the Pacific in San Francisco,
and the Chicago and Boston exchanges.
3)
The CBOE, Chicago Board Options Exchange trades options while the CME, Chicago
Mercantile Exchange and CBT,
4)
There are approximately 3000 companies on the NYSE worth approximately 16
trillion.
5)
The S&P 500 is a broader index covering the 500 largest companies in the
Quotes
1.
Stock Quotes
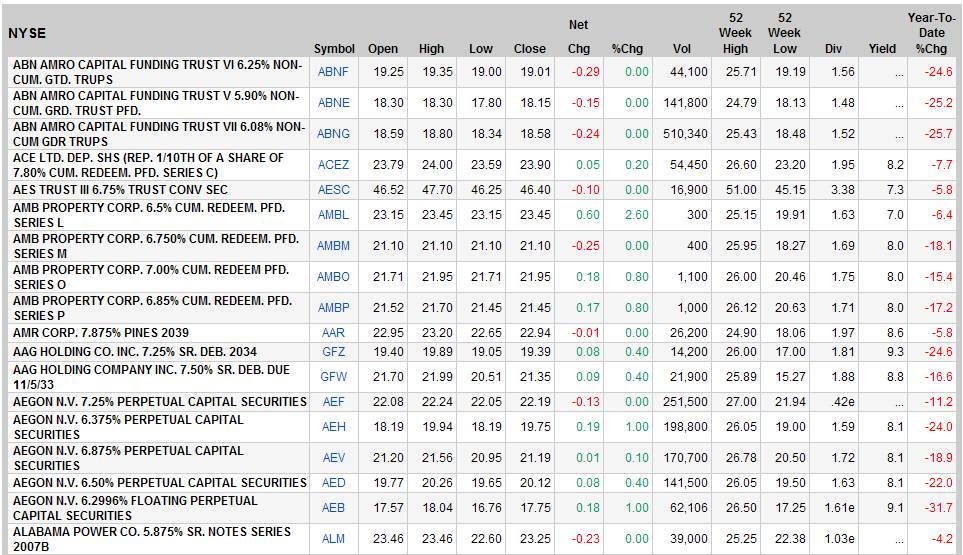
A.
Common Stock

Dividend
Yield is Dividend/Close
PE
is price earnings ratio. PE =
Price/Earnings
B.
Preferred
Stock
Yld is simply
dividend divided by price. Dividend is
only paid if corporation has cash available.
Preferred stock holders cannot force corporation into bankruptcy if they
do not pay. Corporations like buying
preferred stock from other corporations rather than common stock since 80% of
preferred dividends are tax free for corporations. Common stock dividends that corporations
receive do not enjoy an preferred tax treatment.
Data
from 12/31/2007, WSJ
How
to read the Stock Ticker
The stock ticker is that
scrolling numbered and lettered tape often found at the bottom of financial
shows. For instance, you might see the
following:
MSFT5k @ 50.50 ß 0.2
This means that the last trade of
Microsoft was for 5,000 shares at $50.50, down $.25 from the previous
trade. Abbreviations that you will see
are
K = 1,000
M = 1,000,000
B = 1,000,000,000
Color codes are used as well.
Green:
Stock is trading higher than recent close
Red:
Stock is trading lower than recent close.
Blue or White: Stock is unchanged from most recent close.
Not every trade is put up on the ticker,
factors such as volume, price change, activity, and how widely held the stock
is determines whether the trade will be put up on the ticker.
2.
A.
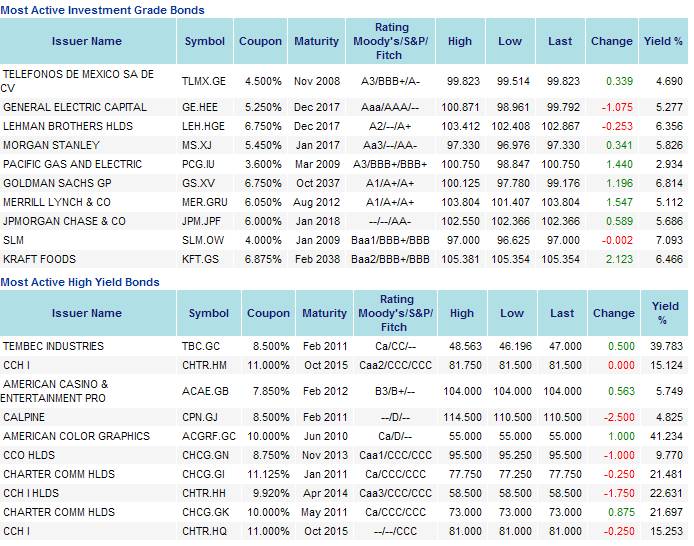
Corporate
Bonds
All bonds
mature at par value which is $1000. General
obligation bonds are sometimes referred to as debentures. The coupon is how much you receive each year
as a % of par. The GE Capital 5.25%
coupon means you receive $52.50 a year until it matures, than you will receive
$1,000. Its closing price was $997.92.
Bond ratings go from AAA(Best credit) to CCC. If the rating is D, then it is considered in
default. BBB or better is considered
investment grade, 0.5% or less chance of default. BB and below, historically default rate is
around 4% but has reached above 10% in 90-91, 2001 for example.
B.
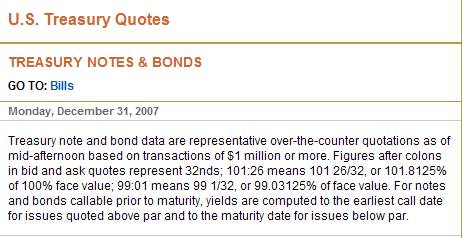
Treasury Bonds
All T-bonds
have a face value of $1,000. The May 15
2017 bond is selling for 136:02 which is 136 and 2/32 or 136.0625% of
$1,000. It’s price is then $1,360.625.

3.
Mutual Funds – Open Ended
Services of
Investment Companies
• Administration & record keeping
• Diversification & divisibility
• Professional management
• Reduced transaction costs
Costs of Investing in
Mutual Funds
• Fee Structure
•
Front-end load
•
Back-end load
• Operating expenses
• 12 b-1 charges
•
distribution costs
paid by the fund
•
Alternative to a load
• Fees and performance
There
is a mutual fund for almost any market segment.
Money market mutual funds are the safest and have a NAV = 1.00.
One
special type of fund is a REIT, Real Estate Investment Trust. To avoid taxes on the income this type of
fund earns, it must payout 95% of its earnings to holders. It is not strictly a mutual fund per se, but
an investment trust.
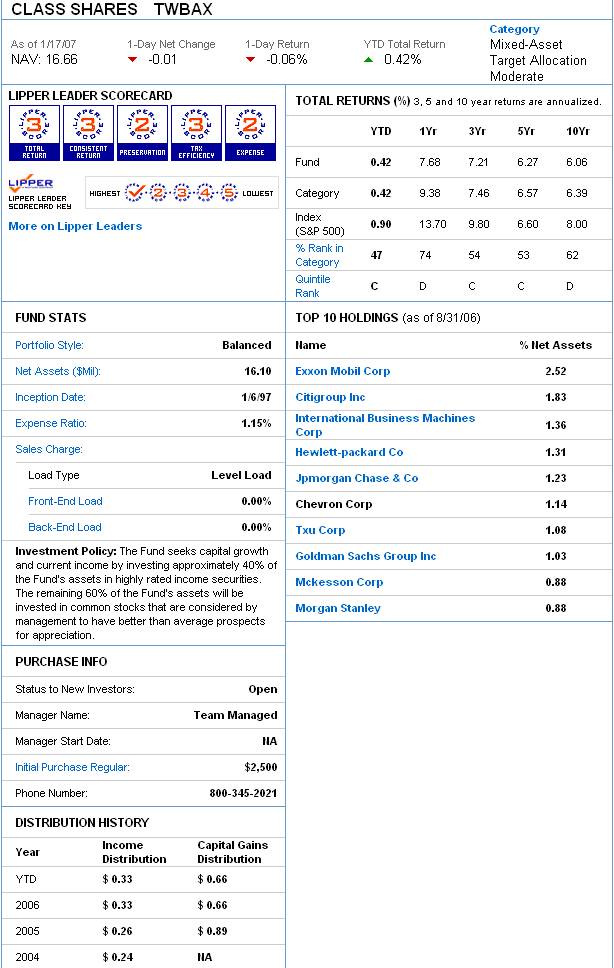
NAV = net asset value, (value of all assets –
liabilities) divided by shares outstanding.
Buying and selling prices are only set at the end of the day meaning
that when buying and selling open ended mutual funds, you will get the 4 p.m.
close price. If you put your order in at
4:05 p.m. you will get the next day’s 4 p.m. closing price.
Expense ratio is how much it costs to run the fund
as a percentage of net assets. Index
funds generally have expense ratios of 0.25% or less. Actively manage funds usually have much higher
expense ratios, sometimes exceeding even 2%.
Front end and back end loads are the amount you have to pay to invest in
the fund. A 2% front end load for
example, costs you $200 if you invest $10,000 in the fund, meaning only $9,800
is actually invested in the fund. Load
funds are often sold by brokers and should generally be avoided.
B. Closed-End Mutual Funds
Mutual funds not open to new investment. Can only buy from other shareholders. They trade just like stock. Price may or may not equal NAV. The prem./disc. is the difference between NAV
and the price. Prem/Disc = (Mkt price –
NAV)/NAV
Open-End
and Closed-End Funds: Key Differences
Shares Outstanding
• Closed-end: no change unless new stock is offered
• Open-end: changes when new shares are sold or old shares are redeemed
Pricing
• Open-end: Net Asset Value(NAV)
• Closed-end: Premium or discount to NAV
CLOSED-END FUNDS: Emerging Markets Funds | Return
to Major Categories | About
Closed End Funds
|
Wednesday, January 17, 2007 |
||||||||
|
|
Weekly
Statistics |
Daily
Statistics |
|
|
||||
|
Fund |
NAV |
Mkt
Price |
Prem/Disc
% |
NAV |
Mkt
Price |
Prem/Disc
% |
52 Week |
|
|
Central
Europe & Russia (CEE) |
52.97 |
49.21 |
-7.10 |
53.38 |
50.44 |
-5.51 |
19.02 |
|
|
Emerging
Mkts Telecomm (ETF) |
19.10 |
18.09 |
-5.29 |
19.32 |
18.28 |
-5.38 |
40.89 |
|
|
First
Tr/Abrdn Emerg Op (FEO) |
20.43 |
18.81 |
-7.93 |
20.51 |
18.94 |
-7.65 |
NS |
|
|
Morg
Stan East Europe (RNE) |
35.75 |
37.58 |
+5.12 |
36.29 |
38.75 |
6.78 |
30.14 |
|
|
Morg
Stan Emerg Mkts (MSF) |
27.45 |
25.96 |
-5.43 |
27.84 |
25.75 |
-7.51 |
29.71 |
|
|
Templeton
Emerging Mkts (EMF) |
17.66 |
17.52 |
-0.79 |
17.70 |
17.80 |
0.56 |
2.99 |
|
|
Templeton
Russia & E Eur (TRF) c |
59.48 |
75.95 |
+27.69
|
61.47 |
76.08 |
23.77 |
43.57 |
|
|
Source: Lipper Inc. |
||||||||
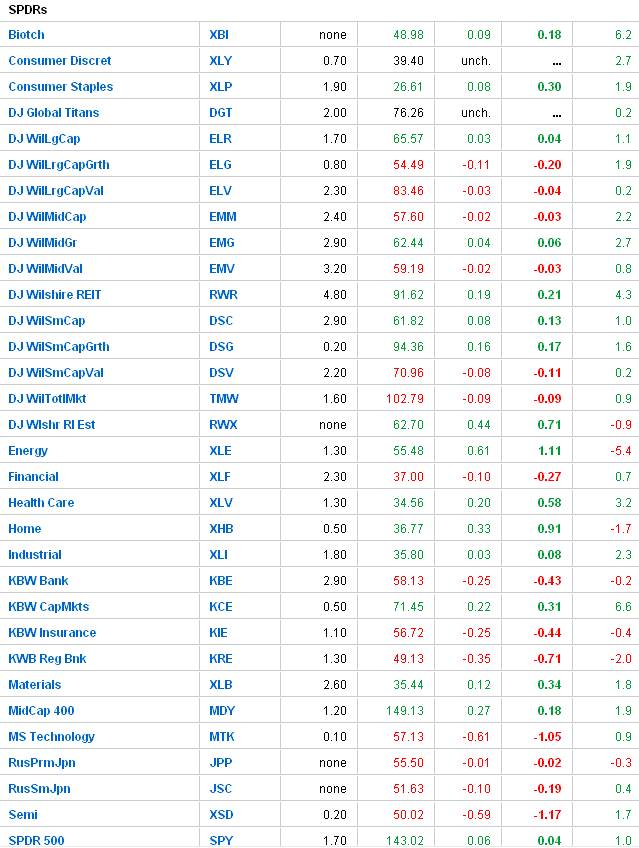
C. Exchange-Traded Funds
These
are mutual funds which you can trade during the day and receive the price at
that time. Price should be very close to
NAV throughout the day.
• ETF allow investors to trade index portfolios like shares of stock
• Examples – SPDRs, Vipers, and Webs
• Potential advantages
•
Trade continuously
•
Lower taxes
•
Lower costs
ETF Price Tables
Wednesday, January 17, 2007
Exchange-traded funds, latest session
|
ETF |
Symbol |
% Yield |
Close |
Chg |
% Chg |
YTD |
4.
Currency Table
This table shows all the major currency
exchange rates. For example, it cost
$1.2156 per Euro or $1.7707 per pound.
Similarly, it cost 0.8226 E per dollar or 1.4566 E per pound. Other rates are read the same way.
|
||||||||||||||||||||||||||||||||||||||||||||||||||||||||||||||||||||||||||||||||||
|
|
||||||||||||||||||||||||||||||||||||||||||||||||||||||||||||||||||||||||||||||||||
|
Above is
a chart designed to display the cross rates of eight major world currencies.
Scan across the chart to find the rate of exchange between any two of these
currencies. |
||||||||||||||||||||||||||||||||||||||||||||||||||||||||||||||||||||||||||||||||||
|
|
||||||||||||||||||||||||||||||||||||||||||||||||||||||||||||||||||||||||||||||||||
|