Valuation of
WalMart
In this study, you are going to analyze and value a company using ratios across time, comparing them to industry averages, calculate a growth rate, determine the cost of capital, and use a constant growth model to value Walmart stock as of 2008. Go to moneycentral.com, type in WMT at the ticker box and on the left hand side click financial results. You will need the info from the income statement, balance sheet, and cash flow statement.
1. Calculate the following ratios for Walmart for 2008 and 2007. Comment on whether WalMart is improving or getting worse. Back up with specific ratios. Comment but no more that ½ page.
a. Current ratio
b. Inventory turnover
c. Leverage ratio
d. Operating profit margin
e. Net profit margin
f. Total Asset Turnover
h. ROA
i. ROE
|
|
2008 |
2007 |
|
a. Current ratio |
||
|
b. Inventory
turnover |
||
|
c. Leverage ratio |
||
|
d. Gross profit
margin |
||
|
f. Net profit
margin |
||
|
e. Total asset
turnover |
||
|
h. ROA |
||
|
i. ROE |
FYI
Liquidity/leverage ratios
Current ratio = Current assets/Current liabilities
Inventory turnover = (Cost of Goods Sold, (CGS))/Average Inventory
Leverage ratio = Avg. Total Assets/ Avg. Total Equity. Generally, we do not need to use averages here but to stay consistent with the next question, calculate using averages.
Operating Efficiency ratios
Total asset turnover = Net Sales/Average Total Assets
Operating Profitability ratios
Gross Profit Margin = Gross Profit/Sales, Gross Profit = Sales - CGS
Net Profit Margin = Net Income/Sales
ROA = (Net Income)/Average total capital (total capital = total assets)
ROE = Net Income/Average Total Equity
2. We are now going to decompose these ratios into the Dupont model. Calculate the Dupont model for 2008 and 2007. (You already have the numbers from question 1). Using this model, explain why the ROE has been increasing or decreasing over the last two years. ½ page.
Dupont: ROE = (Net Income/Sales * Sales/Avg.Tot.Assets * Avg. Tot.Assets/Avg.Tot.Equity
Note that averages must be used throughout in this equation since we have combined income statement items with balance sheet items.
|
Net Profit Margin |
Tot. Asset turnover |
Leverage Ratio (Averages) |
ROE |
|
|
2007 |
||||
|
2008 |
3. Using a 50 day moving average graph, is WMT trading above or below its 50 day moving average? Copy and paste graph and include in report. To do this question, go to charts. Make sure the time horizon is 1 year.
Problems with copying graph??? Try this trick. Hit Ctrl and the Print Screen button at the same time while the graph is on the screen. Now go to start, programs, accessories, and open up Msoft Paint. Hit Ctrl V or simply paste under the edit button. The graph should show up. Now simply cut the graph part of screen out, and copy into Word. That is what I did below.
Example: In the graph below, WMT is above its 50 day moving average. Generally, technicians assume it is a buy signal when a stock moves above its moving average and a sell signal when a stock moves below its moving average.
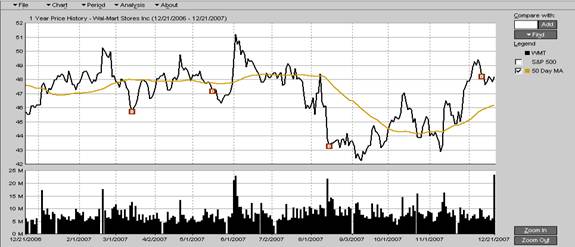
From moneycentral.com
4. We are now going to perform a relative valuation estimate using PE ratios. To do this, you simply need to estimate next year’s PE ratio and next year’s EPS(earnings per share). Then multiply together. Using Moneycentral under Financial Results, click on key ratios, then click on the 10 year summary.
Step 1:
Use the average PE for 01/08. We will use that as our best estimate for next year. For our optimistic estimate, use the highest average PE since 2006. For a pessimistic estimate, use the lowest average PE since 2006. If the current PE is the highest or lowest, add or subtract 20% to the average 2008 PE.
Step 2: At Moneycentral, click on earnings estimates. For FY(1/09), find the average, high and low estimate. We will use the average as our “best guess.” Now fill in the table below by writing in the PEs in the first column and the earnings in the first row. Simply multiply the earnings by the PE ratios to fill in the table. The middle square is your best estimate, while the upper left is the worst possible outcome and the lower right is the best possible outcome. The numbers in the table below are an example only.
|
Earnings P/E |
Low est. = $1.50 |
Average = $2 |
High est. = $3 |
|
Pessimistic = 12 |
$18 |
$24 |
$36 |
|
Expected = 14 |
$21 |
$28 |
$42 |
|
Optimistic = 16 |
$24 |
$32 |
$48 |
5. In 2008 Walmart’s Beta was 1.2. If the risk-free rate was 5% and the expected return on the Market is 11%, what is the required return on Walmart stock. Use the CAPM. Recall the CAPM is Ri = rf + Beta(Rm – rf)
6. Calculate the growth rate for Walmart by using ROE * (1 – payout ratio) where the payout ratio is calculated by dividing dividends by earnings or net income.
7. What is Walmart's Dividend per share?
8. What is Walmart's FCFE per share? Recall that this is FCFE = NI – (1 – DR)(Capital Spending + change in Working Capital – Depreciation). Use my spreadsheet. For capital spending and depreciation, use the statement of cash flows. The debt ratio = total liabilities/total assets.
9. Using the three stage model, calculate the intrinsic value of WalMart stock assuming current growth(use average estimate from question 6) continues for 5 more years, at which time it will slow over the next 5 years to 5% in stage 3. Leave cost of capital the same for stage 1 and 3 and it should be the number you calculated in question 5. First, using dividends, what value do you get for Walmart? Now, using FCFE per share, what value do you get for Walmart? Copy and paste 3-stage model output for both dividends and FCFE output here or attach with your report.
10. Now using all of the information you have looked at in questions 1-9, make a recommendation. Would you recommend buying this stock? Also note that just because Walmart may be a great company, does not necessarily make it a great stock purchase. The current market valuation may be overly optimistic or pessimistic regardless of the underlying fundamentals. ½ page.