DATA GATHERING
Five randomly selected Curly episodes and five randomly selected Joe episodes were chosen. The number of acts of violence by Moe to these Stooges is as follows:
|
Curly
|
Joe
|
| Episode (number) |
# of Acts |
| Back to the Woods (23) |
12 |
| Three Missing Links (34) |
9 |
| An Ache in Every Stake (57) |
6 |
| Sock-a-Bye Baby (66) |
3+ |
| A Bird in the Head (89) |
3+ |
|
| Episode (number) |
# of Acts |
| A Merry Mix Up (177) |
4 |
| Space Ship Sappy (178) |
1+ |
| Horsing Around (180) |
2 |
| FiFi Blows Her Top (184) |
4 |
| Oils Well that Ends Well (188) |
4 |
|
The plus signs (+) indicate that data is incomplete. It includes only part of the date for particular episodes. Davidson and Gardner have already watched parts of these episodes and collected part of the data. The remainder of the data will be collected by the class/audience while watching the remaining parts of the episodes.
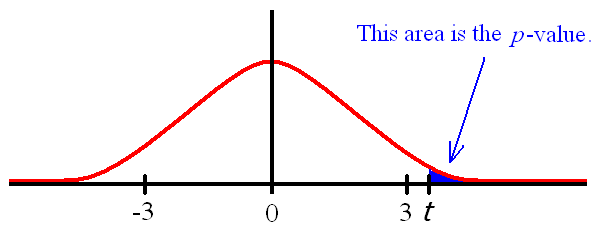
This time, since we suspect that the average for Curly is greater than the average for Joe, we perform a one-tailed test.
We now watch 3 to 5 minute segments of some of the randomly chosen shorts to fill in the missing data.
We want to count every act of violence of Moe towards Curly, and Moe towards Joe.
A Bird in the Head
Columbia short number 89, costarring Curly.
This short is classic Stooges and has the boys wallpapering a room.
Sock-A-Bye Baby
Columbia short number 66, costarring Curly.
A baby is abandoned on the Stooges’ doorstep, and they prepare a meal and diaper change.
Space Ship Sappy
Columbia short number 178, costarring Joe.
The Stooges act as "sailors" on a spaceship to Venus.
We now use Excel to compute the mean, variance, t-statistic, and p-value for our collected data.
 The numbers agreed upon at the meeting are as follows:
A Bird in the Head: 9
Sock-A-Bye Baby: 13
Space Ship Sappy: 5
Our data yield a p-value of: 0.0032
Therefore, we reject the null hypothesis:
H0: "The average number of violent acts by Moe against Curly per episode is the same as the average number of violent acts by Moe against Joe"
And accept the alternative hypothesis
Ha: "The average number of violent acts by Moe against Curly per episode is greater than the average number of violent acts by Moe against Joe."
With confidence (1-p) x 100% = 99.68%
Nice!
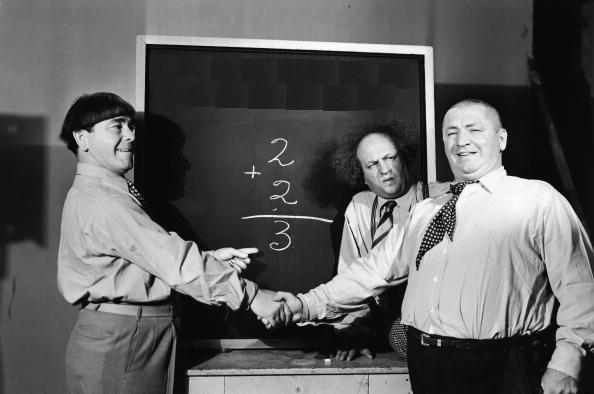
From
http://www.viewimages.com/Search.aspx?mid=51309234&epmid=3&partner=Google
Go to the next section.
Return to
The Three Stooges Statistics webpage.


