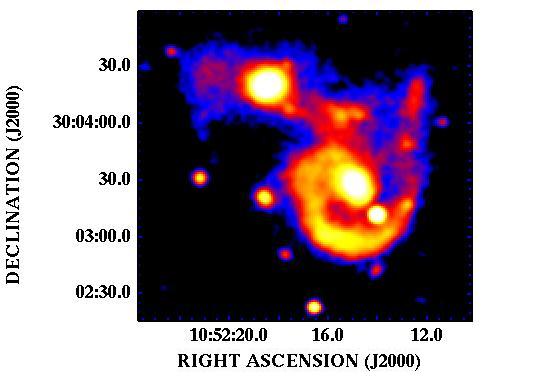
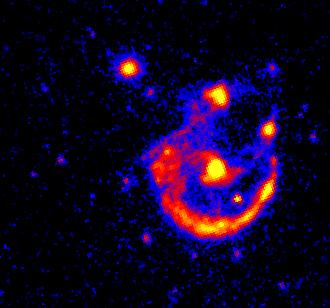
An broadband optical R band image of Arp 107 from the Fick Observatory in Boone Iowa. Note the strong primary arm/partial ring in the south, the tail to the northwest, the bridge, and the plume to the northeast of the companion.
An broadband optical R band image of Arp 107 from
the
Fick Observatory in Boone Iowa.
Note the strong primary arm/partial ring in the south,
the tail to the northwest, the bridge, and the
plume to the northeast of the companion.
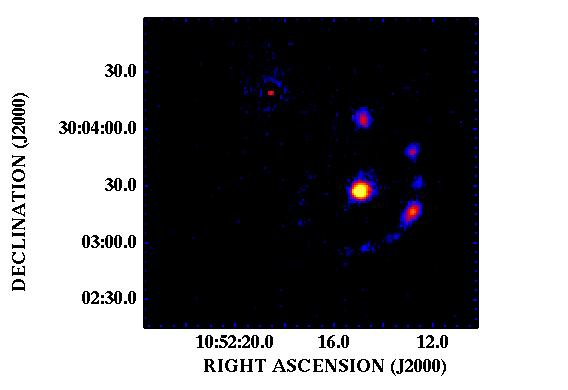
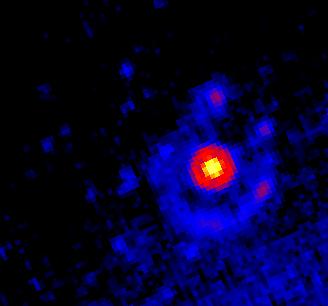
An continuum-subtracted H-alpha image of Arp 107 from
the
Fick Observatory.
Note the clumps of star formation in the ring.
The artifacts near the companion are due to imperfect continuum-subtraction.

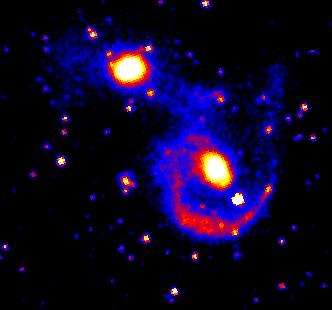
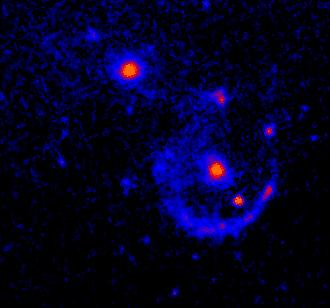
Spitzer images of Arp 107 (UGC 5984).
North is up and east to the left. Left to right, top to bottom:
1) IRAC band 1 (3.6 microns),
2) IRAC band 2 (4.5 microns),
3) IRAC band 3 (5.8 microns),
4) IRAC band 4 (8.0 microns),
5) MIPS
24 microns.
The field of view is the same as in the optical images shown above.
The morphology of this system appears very different
at these three wavelengths.
The bridge is clear at 3.6 microns but almost disappears at 8.0 microns.
The knots in the ring are more prominent
at 8.0 microns than at 3.6 microns.
The elliptical companion is very faint at 24 microns but the
ring is clearly visible.
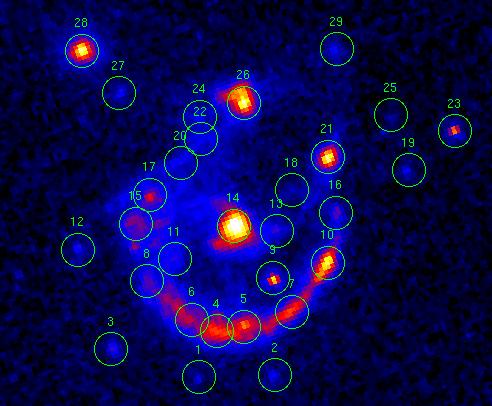
In the 8 micron image, 29
clumps were identified by eye in the vicinity
of Arp 107. These are identified in this color view of the
8 micron image, encircled by 5" radii regions.
Note that some fainter clumps are not included.
Also, in some cases, when a second fainter clump was very close to
a brighter clump, so that their regions strongly overlapped,
the second clump was not included.
The regions are numbered by increasing declination, with the
labels being directly above the respective region.
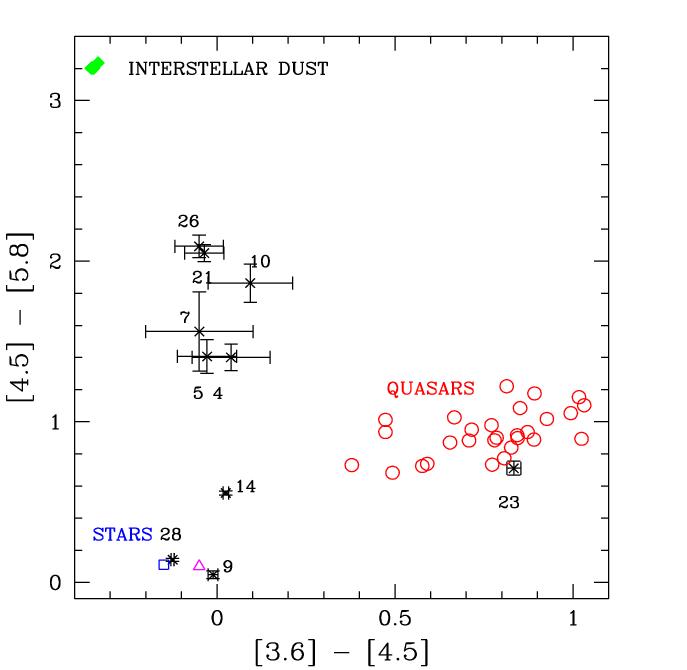

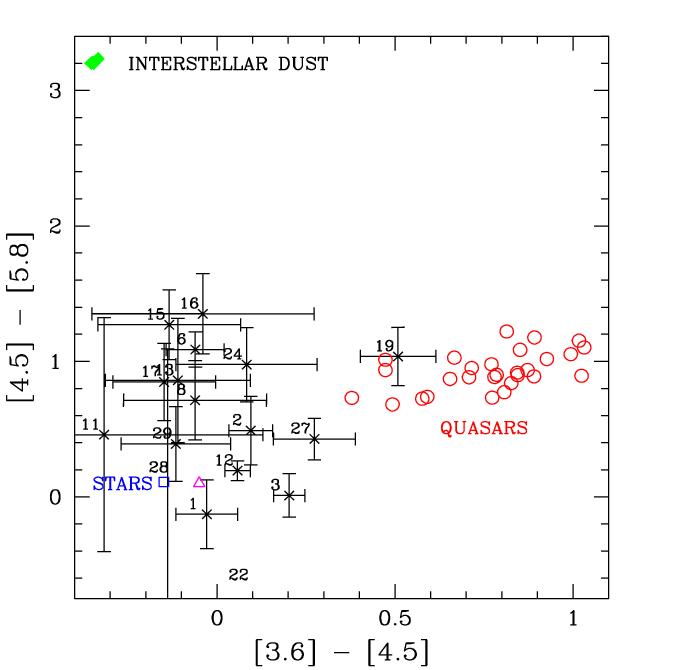
The IRAC colors of the brightest 8 micron clumps
in Arp 107 (black crosses). These clumps are labeled.
This plot also contains the colors of M0III stars (open dark blue square)
(from M. Cohen 2005, private communication)
and the mean colors for the field stars in Whitney et al. (2004)
(magenta triangle). The green diamonds mark the predicted
values for the Li and Draine (2001) dust models, for
a very large range of interstellar radiation field intensities.
The red circles show the locations of the Sloan Digitized Sky Survey
quasars in the Spitzer Wide-Area Infrared Extragalactic Survey (SWIRE)
Elais N1 field (Hatziminaoglou et al. 2005). These quasars have
redshifts between 0.5 and 3.65; since their spectral energy distributions
are power laws, their infrared colors do not vary much with redshift.
The photometry was done using the IRAF daophot routine, with 4.1 pixel (5") radii apertures (as shown in the above figure). The sky was determined using the mode in an annulus surrounding the source, with an inner radius of 5 pixels (6") and an outer radius of 10 pixels (12"). The errorbars include both statistical uncertainties and an uncertainty in the colors due to varying the sky annuli (see paper). No color corrections were made. Aperture corrections were included, although they have only a tiny effect on the IRAC colors of these clumps. As given in the IRAC Data Manual, the aperture corrections are 1.06, 1.06, 1.07, and 1.09 for IRAC bands 1 - 4, thus the color change due to the aperture correction are very small.
Notes on the colors:

Plots of position angle vs. Spitzer IRAC
colors
for the clumps in the ring. As noted
above, there is a strong azimuthal trend for the [4.5] - [5.8] color.
No trend is visible in the
[3.6] - [4.5] color.
For
the [5.8] - [8.0] color, there is a slight variation (0.2 magnitudes)
compared to that in the [4.5] - [5.8] color (1 magnitude).
The lack of a strong variation in the [5.8] - [8.0] ratio suggests
that these two bands are dominated by dust emission, and the dust
spectrum does not vary strongly around the ring.
This plot shows that the large variation in the [3.6] - [8.0]
color around the ring is mainly due to variations in
[4.5] - [5.8].
Clumps #20 and #22 are not shown in the second and third panels
since their 5.8 micron uncertainties are very large.
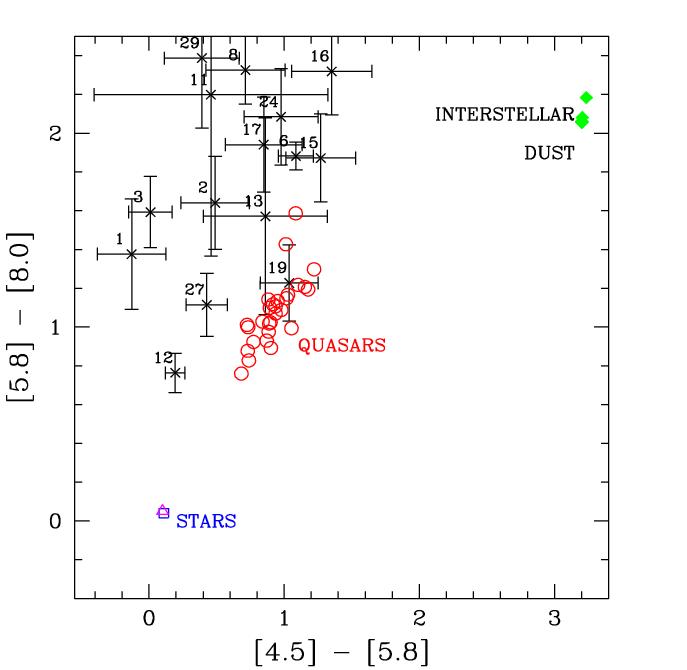
These plots show the color-color diagrams of the fainter
Arp 107 clumps.
Note
the positions of:
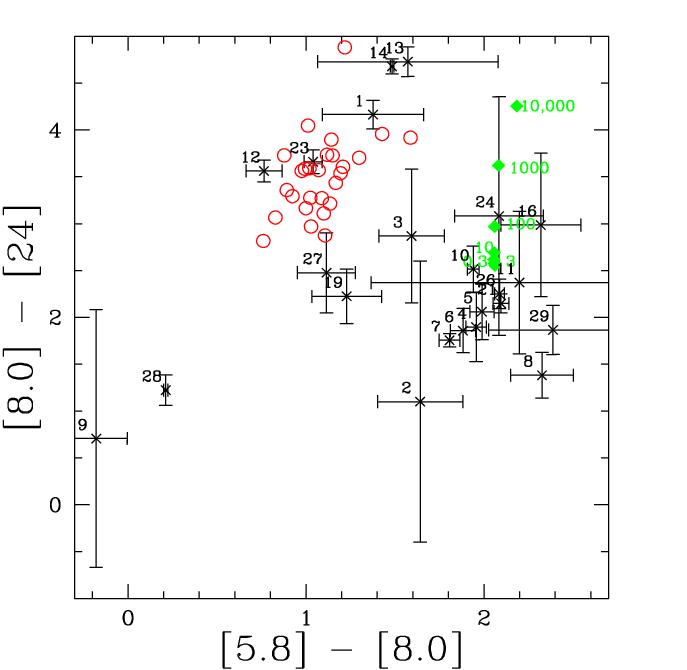
The [5.8] - [8.0] vs. [8.0] - [24] colors for the clumps.
The clumps (black crosses) are labeled to the upper left of the
corresponding datapoint. The green diamonds are the locations of
the Li and Draine (2001) dust models, with various interstellar radiation
fields scaled to the solar neighborhood radiation field.
The red circles are the locations of the
Hatziminaoglou et al. (2005) quasars.
Stellar photospheres are expected to lie near
[5.8] - [8.0] ~ 0, [8.0] - [24] ~ 0.
The 24 micron fluxes were measured within a 5" radius aperture, and a background annulus with an inner radius of 10" and an outer radius of 15". The errorbars include both the statistical uncertainties, and a term due to varying the background annuli (see text). The 5" radius aperture used in the photometry is too small to include all of the light from the clump, given the ~6" FWHM PSF for MIPS 24 micron observations and the 2.45"/pixel plate scale. Using a larger aperture radius, however, is not a viable option, since the clumps are crowded. Thus a substantial aperture correction is required.
According to the MIPS Data Handbook, a 5" aperture includes only ~50 percent of the total light from a point source. Testing this using large aperture data for the isolated source #23 (which may be a background quasar) and two bright sources in the field far from the galaxy, we get consistent aperture corrections. Thus we have adjusted the [8.0] - [24] colors using this correction. Including the 8.0 micron aperture correction given above, the aperture corrections shift the data points upwards on this plot by 0.65 magnitudes in [5.8] - [8.0] color. This plot includes this correction.
No color corrections were included in determining these colors.
Note:
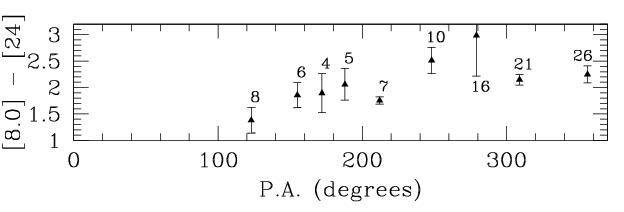
The [8.0] - [24] micron color of the ring clumps, as a function
of position angle.
As noted above, the clumps in the southern part of
of the ring have slightly bluer [8.0] - [24] colors
than the bright clumps in the north.
Thus the northern/western clumps
may have stronger interstellar radiation fields.
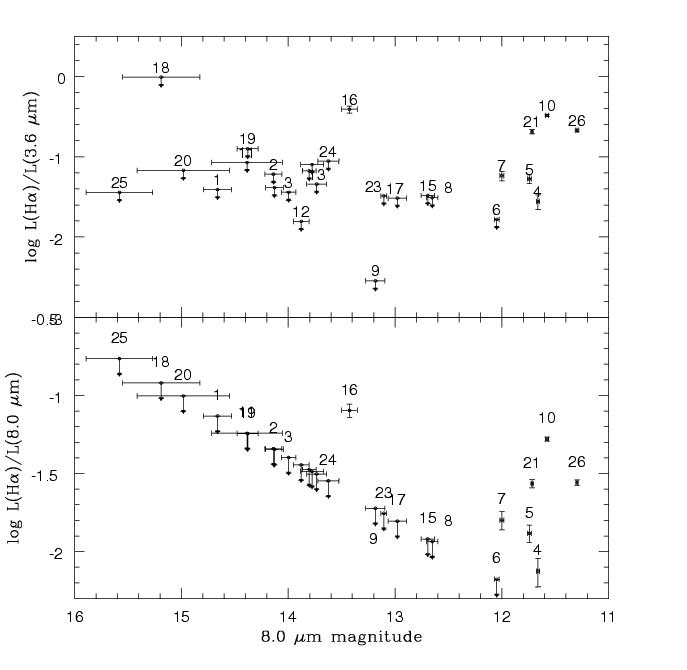
For the clumps in Arp 107,
the ratio of the H-alpha fluxes
to those in the Spitzer 3.6 and 8.0 micron bands,
compared to the 8.0 micron magnitudes.
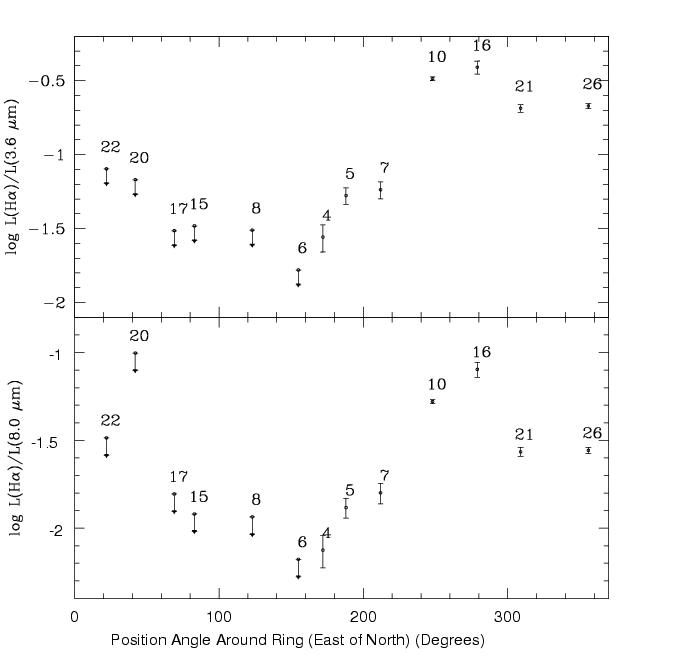
The ratio of H-alpha to 3.6 micron, and the ratio of H-alpha
to 8 microns, vs. position angle for clumps in the arm/ring.
Note the azimuthal trend. This trend may be caused by extinction
of the H-alpha emission; alternatively, it may be caused by
PAH excitation by non-ionizing photons.
To see more Spitzer results on interacting galaxies, click here.
Last updated 10/31/05 by B. J. Smith.