AN EXAMPLE OF A STATISTICAL TEST

Since we have no reason to suspect a difference between the amount of violence from Moe to Curly or from Moe to Shemp, we test for a difference and perform a two-tailed test. This gives the following null and alternative hypotheses:
H0: "The average number of violent acts by Moe against Curly per episode is the same as the average number of violent acts by Moe against Shemp."
Ha: "The average number of violent acts by Moe against Curly per episode is different than the average number of violent acts by Moe against Shemp."
Five randomly selected Shemp episodes and five randomly selected Curly episodes were chosen. The number of acts of violence by Moe to these Stooges is as follows:
|
|
||||||||||||||||||||||||
|
|
|
The sample standard deviation, s, of a sample of size n is:
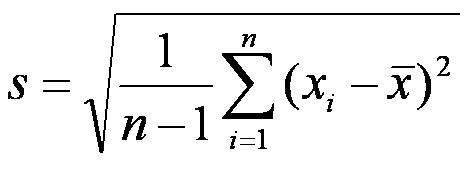
|
s1 = 4.9670, s12 = 24.7 |
s1 = 2.3022, s12 = 5.3 |
The two sample t-test assumes that samples are taken from a normal distribution. Given the means and standard deviations of our samples, this is a reasonable assumption. The t statistic for this data is calculated as:

Since we have no reason to suspect a difference between the amount of violence from Moe to Curly or from Moe to Shemp, we test for a difference and perform a two-tailed test with t = 1.470.
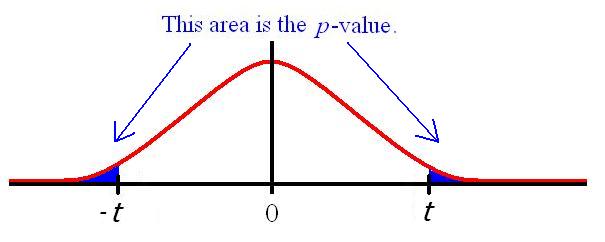
Excel gives a p-value for this data of:

Go to the next section.
Return to The Three Stooges Statistics webpage.