ANALYSIS
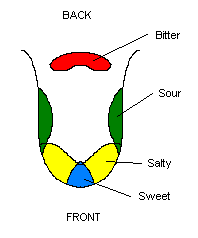
After entering the data into the database; you can use this data to test hypothesis concerning the distribution of taste receptors. Consider the “original” tongue map that is found in most textbooks (Fig 1). Notice that the regions of the tongue corresponding to our experiment are as follows:

LEGEND Figure 1: Front-Region 1; Side-Region 2; Middle- Region 3;
Back- Region 4
Now lets look at the steps you can take to test an hypothesis.
STEP 1: Consider the following: the tongue map suggests that sweet and salty can be tasted in the front (Region 1) of the tongue.
STEP 2: Lets test this hypothesis by collecting data from the database.
We will visit the database at http://faculty.etsu.edu/millerh/tongue/tongue_experiment.htm and view the results page. The initial data is all the data entered in the database but we can refine our search by following this link: Put position 1 in the search box and hit Submit Query. The results we get back are data for only position 1. You can collect the data into Excel by copying the data and opening Excel and pasting the data into an Excel spreadsheet. From here you can sort and manage the data. See an example EXCEL file.
You will notice that in the database, numbers are used to denote data. The table below shows the corresponding identity for each number.
|
SUBSTANCE |
TASTE |
|
Sucrose=1 |
Sweet=1 |
|
Salt=2 |
Sour=2 |
|
Acetic Acid=3 |
Salty=3 |
|
Quinine=4 |
Bitter=4 |
|
Water=5 |
None=5 |
|
Mix=6 |
|
STEP 3: Look in the TASTE column and count the number of responses for each taste (we are not going to consider whether the taste was correct or not for this example). Add up the total responses in the example EXCEL file, 27+17+15+9+15= 83. List the total responses in the table below. NOTE, I decided that since the tongue map shows only Sweet and Salty at position 1, we were going to be simple and calculate the EXPECTED as 50% Sweet and 50% Salty. To calculate the EXPECTED results take the total 83 and divide equally (50% each) between Sweet (41.5) and Salty (41.5).
|
Number of Responses |
Total responses (OBSERVED |
Responses expected from tongue map (EXPECTED) |
|
Sweet-13 |
27 |
41.5 |
|
Sour-8 |
17 |
0 |
|
Salty-15 |
15 |
41.5 |
|
Bitter-16 |
9 |
0 |
|
None-27 |
15 |
0 |
Go to the Chi Square Calculator at: www.graphpad.com . (Be sure to use the correct number of rows (5) and columns (2).
Enter the data and find that the difference is significant, p<0.001. This means that the course wide data is different than the original tongue map assuming a 50:50 sweet to salty ratio.
ASSIGNMENT: Using the previous example as a guide, choose one of the following questions to test. Report your result on the Tongue Taste Result page that can be downloaded and submitted to your TA.
QUESTIONS:
1. Does the course-wide data support the original tongue map at position 2?
2. Does the course-wide data support the original tongue map at position 3?
3. Does the course-wide data support the original tongue map at position 4?
4. At position # ____ is there aggreement between the SUBSTANCE and the TASTE?
(choose any position and SUBTANCE/TASTE combination)
5. At position # _____does smoking affect the response to a SUBSTANCE?
(choose any position and SUBTANCE/TASTE combination)
6. Is the detection level for all 4 SUBSTANCES above that for WATER for all 4 tongue positions?
7. Do we taste sweet (or sour, salty, or bitter) equally well at all tongue positions?