
The NGC 4410 galaxy group
contains five major galaxies in its inner regions,
at least four
of which appear to be connected in some way.
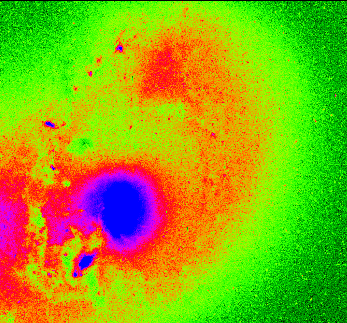
Here is a smoothed
0.3 - 8 keV X-ray map of the inner portion of the NGC 4410
group from the
Chandra X-ray Telescope
(color),
after it has been divided by a smoothed
weighted
exposure map (from Smith et al. 2003, in preparation).
The yellow/white regions are brightest
in X-rays, the red fainter, and the blue
faintest. The black region outside of
the blue rectangular area was not observed
by Chandra.
The contours are from the
optical
Digitized Sky Survey.
(from
Smith et al. 2003,
Astronomical Journal,
126, 1763).
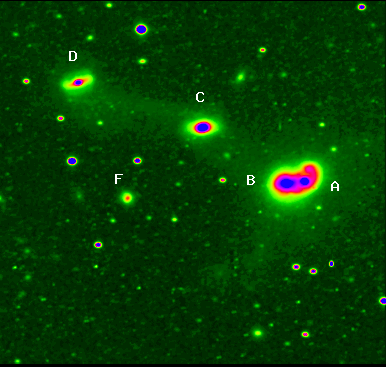
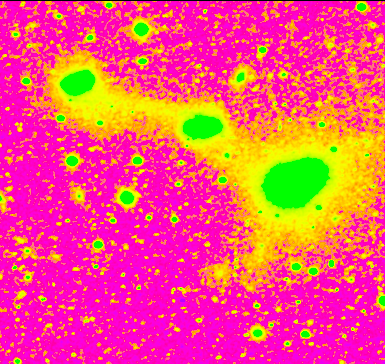
The five galaxies in the inner part of this group are labeled in the pictures below, which is an optical R-band image from the Southeastern Association for Research in Astronomy (SARA) 0.9m telescope. This image is displayed with two different stretches. In the first picture below, the stretch is such that the two galaxies NGC 4410 A+B are each visible. In the second picture, the stretch is set such that the faint bridges connecting NGC 4410A+B with NGC 4410C and NGC 4410D are visible, as well as the long tail extending to the southeast of NGC 4410A+B. The field of view in these images is about 6.7 arcminutes by 6.3 arcminutes. North is up and east is to the left.
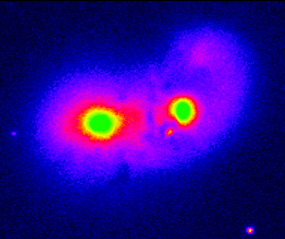
Here is a close-up view of NGC 4410A+B, showing a ring-like
structure in NGC 4410A, the galaxy
on the right (west)
(from
Donahue, Smith, and Stocke 2002,
Astronomical Journal,
123, 1922).
The left image is a red continuum
image, the right image is an image obtained with a narrowband
filter containing the 6583 Angstrom hydrogen alpha line.
This image shows the location of the ionized interstellar gas
in this system.
The bright clumps in the ring are HII regions.
Notice the extremely bright HII region southeast of
the NGC 4410A nucleus.
The field of view is about 0.8 arcminutes X 1.1 arcminutes.
These images were obtained by
Megan Donahue on the
2.1m telescope at
the
Kitt Peak National Observatory in Arizona.
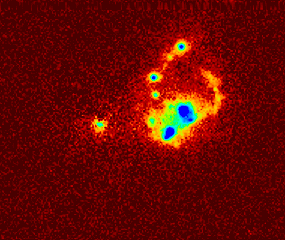
Here is a very close-up optical image of
NGC 4410A (below),
from the Hubble Space Telescope.
The field of view is 34"; north
is up and east is to the west. Notice the ring-like structure
to the northwest, and the knots of star formation on the eastern
section of the ring and the especially bright knot to the south
of the nucleus. NGC 4410B is at the edge of the image, to the
west.
Here is an expanded view of the 0.3 - 8 keV Chandra image near NGC 4410A+B.
The bright peak is at the nucleus of NGC 4410A. The secondary
peak to the east is at the nucleus of NGC 4410B.
The extension to the northwest is coincident with the
northwestern filament of ionized gas, which has an optical
spectrum suggestive of shock ionization.

Here is an overlay of the H-alpha image
(contours) on the Chandra image (colors).
Notice the coincidence of the X-ray and
H-alpha extension to the northeast,
as well as the similar morphology near
the NGC 4410A nucleus.
Notice that the HII regions
do NOT have obvious X-ray counterparts.

In the next picture, the optical
Digitized Sky Survey.
image of the inner part of the NGC 4410
group is shown, with circles plotted showing the
location of X-ray point sources found in the Chandra
data.
Two of these sources, labeled 2 and 5 in this picture,
have optical counterparts.
These may be background active galaxies. Sources 3 and 8
have large number of high-energy X-ray photons compared to
those at lower energies, suggesting that they may also
be background objects. If the remaining
sources, 1, 4, 6, and 7, are associated with the NGC 4410 group,
they would be classified as
`Ultraluminous X-Ray Sources' (ULXs), with X-ray luminosities greater
than or equal to 1039 erg/s.
This is much higher than typical X-ray binaries in the Milky Way,
which are thought to contain stellar black holes (masses of about 10 times
that of the Sun). ULXs are thought
to be either intermediate mass black holes (about 100 times the mass
of the Sun or more), or else stellar mass black holes with jets aimed
towards
us.

In the following larger field of view image, contours showing the location of the interstellar atomic hydrogen gas are superposed on the SARA optical image of the inner part of the NGC 4410 group, including NGC 4410A, B, C, D, and F. NGC 4410A+B, D, and F are detected in HI. NGC 4410A+B and D both have tail-like HI structures, coincident with stellar tails. HI is detected via the 21 cm radio line. These data were obtained with the Very Large Array, part of the National Radio Astronomy Observatory (from B. J. Smith 2000, Astrophysical Journal, 541, 624).

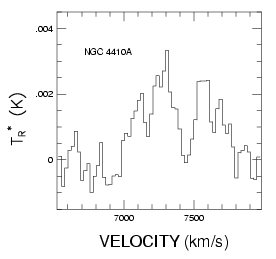
NGC 4410A, the ring-like galaxy, was also detected in
the 2.6mm line of carbon monoxide, showing that molecular
gas is very abundant in this galaxy. The CO spectrum
shown below
was obtained with the
NRAO 12 meter telescope
on Kitt Peak in Arizona.
A much larger field of view image of the NGC 4410 group is shown below.
The grey scale is the
Digitized Sky Survey
optical image; the contours are the 21 cm HI map
from the Very Large Array.
Seven galaxies in this group were detected in HI;
these galaxies are labeled. The increased noise at
the edge of the HI map is due to decreased sensitivity
at the edges of the primary beam.
The two optically-bright galaxies
near the bottom of the image are NGC 4411 and NGC 4411B (west
and east, respectively).
These are foreground galaxies in the Virgo Cluster,
and are not in the observed HI velocity range.

NGC 4410A is a radio galaxy, with two large lobes visible
in radio continuum maps. The next image is a 20 centimeter
radio continuum map of the NGC 4410 group (contours; from
the Very Large Array),
superposed on the optical
Digitized Sky Survey
image (greyscale).
Note the two large radio structures, one extending
200 kpc to the north, the other 80 kpc to the south.
These lobes are presumably
caused by electrons and protons being ejected at high
speeds from the vicinity
of a massive black
hole in the center of the galaxy.
The southern lobe may been distorted by a collision
with the atomic hydrogen
gas in the tidal tail.
A higher spatial resolution radio continuum
map of this system can be found
in
Hummel et al. (1986), A+A, 155, 161.
To see more Chandra images of this system in different
energy ranges, click here.
To see how different assumptions in making the exposure map affects
the final Chandra image, click here.
To return to Beverly Smith's home page, click
here
Last updated: 2/10/05

To look at my poster on NGC 4410 from the Gas and Galaxy
Evolution Conference, click
here.
To read my conference proceedings
for that meeting, click
here.
To read my paper on the atomic and molecular
interstellar gas
in the NGC 4410 galaxy group (Smith 2000,
Ap. J., 541, 624),
click
here.
To read the Donahue, Smith, and Stocke paper on
star formation in NGC 4410A+B, click
here.
(2002, AJ, 123, 1922).
To read the Smith
et al. (2003, AJ,
126, 1763) paper on the
Chandra observations of NGC 4410, click
here.
To see our Chandra results on the interacting galaxy pair
NGC 7714/5 (Arp 284), click
here, and to read the paper, click
here.